
Promising Markets For Olive Oil
Overview
Lebanon has been among the top 20 exporters of olive oil globally for at least the last two decades. Exports have been growing at a CAGR of 14.54% from $1,525,000 in 2001 to $23,023,000 in 2020. In the coming years, promising opportunities can be found in Saudi Arabia, Canada, United States of America, Brazil, Germany and Ukraine for the Lebanese olive oil. This document gives an overview about the olive oil market, takes a closer look Lebanon’s exports and worldwide imports and highlights potential growth opportunities of Lebanon’s olive oil exports.
Product Definition
Olive oil can be classified in several categories depending on the production method:
The above listed categorization is a simplified version of the International Olive Council (IOC) standards. The European Union marketing standard is slightly different, defining ‘lampante’ as each olive oil with more than 2% acidity, excluding the ordinary olive oil category. Olive oil with lower quality, such as crude pomace or lampante, can be also used for technical purposes, for example, as a fuel.
All grades of olive oil are produced in Lebanon. This report uses the combined nomenclature code 1509 ‘olive oil and its fractions obtained from the fruit of the olive tree solely by mechanical or other physical means under conditions that do not lead to deterioration of the oil, whether or not refined, but not chemically modified’.
-
Virgin olive oil which is obtained solely by the first mechanical pressing without further treatment. Virgin olive oils include several quality categories, such as:
- Extra virgin olive oil (with <0.8% free fatty acids) which possesses excellent taste and scent;
- Virgin olive oil (with <2% free fatty acids) which has good taste and scent;
- Ordinary olive oil (with <3.3% free fatty acids);
- Refined olive oil – obtained by refining lampante (oil with higher acid content )olive oil by removing acids, color and odor.
- Olive oil – a blend of virgin and refined olive oils, called pure or edible, contains less than 1% free fatty acids.
- Pomace oil – obtained by treating olive pomace with solvents or other treatments. After refining, pomace oil can be directly consumed or mixed with virgin olive oil to improve quality.
The above listed categorization is a simplified version of the International Olive Council (IOC) standards. The European Union marketing standard is slightly different, defining ‘lampante’ as each olive oil with more than 2% acidity, excluding the ordinary olive oil category. Olive oil with lower quality, such as crude pomace or lampante, can be also used for technical purposes, for example, as a fuel.
All grades of olive oil are produced in Lebanon. This report uses the combined nomenclature code 1509 ‘olive oil and its fractions obtained from the fruit of the olive tree solely by mechanical or other physical means under conditions that do not lead to deterioration of the oil, whether or not refined, but not chemically modified’.
Lebanon's Olive Oil Key Export Destinations
It is estimated that Lebanon has been able to produce around 25 thousand tons of olive oil annually over the last decade. According to FAO, Lebanon was the 15th largest producer globally of olive oil in 2018, with a share of 0.5% of world production.
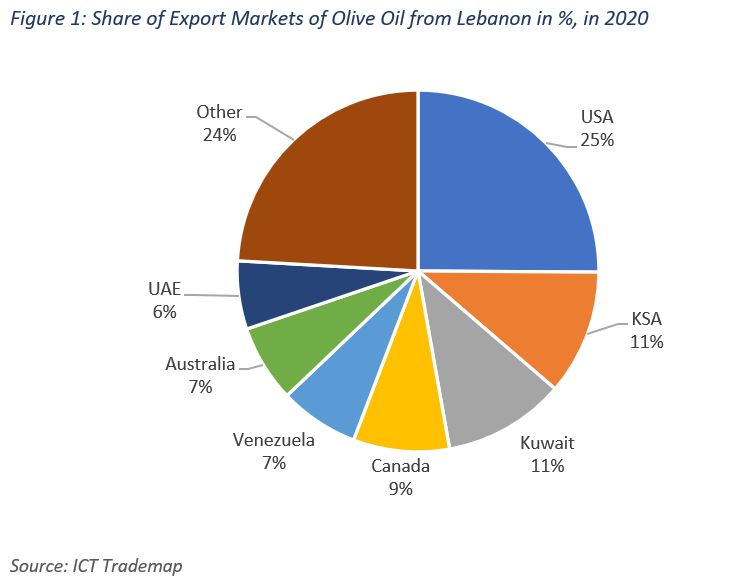
In recent years, the export volume amounted to between 7 to 10 thousand tons per year. In 2020, a quarter of Lebanon’s olive oil was exported to the United States and around 50% to Saudi Arabia, Kuwait, Canada, Venezuela, Australia and the United Arab Emirates. (Figure 1).
In recent years, the export volume amounted to between 7 to 10 thousand tons per year. In 2020, a quarter of Lebanon’s olive oil was exported to the United States and around 50% to Saudi Arabia, Kuwait, Canada, Venezuela, Australia and the United Arab Emirates. (Figure 1).
Lebanon's Position in International Markets
Countries of the Mediterranean Basin produce the majority of the world supply. For more than two decades, Spain has been the leading producer of virgin olive oil.
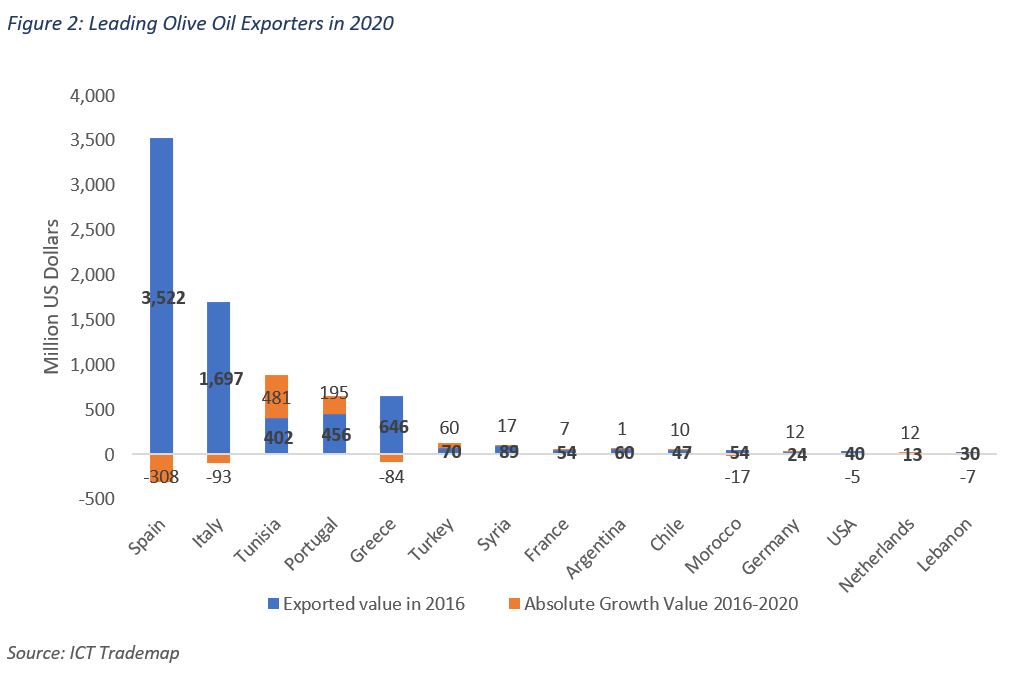
Spain is the leading global olive oil exporter despite recent decrease in exports, followed by Italy, Tunisia, Portugal and Greece. The value of Tunisia’s olive oil exports more than doubled with quantities increasing by more than two-folds. The value and quantity of Portugal’s olive oil exports increased by 43% and 73% respectively. The increase in exports of olive oil from Tunisia and Portugal affected olive oil imports from Italy and Greece adding to the effect of the decline in olive production the two countries faced.
Lebanon’s share in the value of global trade of olive oil was 0.3% in 2020. Olive oil exports from Lebanon stood at $23 million in 2020, a 24% drop compared to 2016 levels, the highest export value recorded. In the same period, the quantity exported dropped by 31% and leveled at 7 thousand tons in 2020. Lebanon ranked 15th in terms of export value and 13th in terms of export volume in 2020.
Lebanon’s share in the imports of most countries is low, which leaves room for future market share expansion. This situation is different for the exports to Kuwait and Venezuela. Lebanese olive oil exports to these countries constituted an impressive share of 76% and 82%, respectively, of the imports of these two countries.
In terms of duties, the European market and also other region’s markets are not a level playing field for exporters of olive oil:
- Among the leading exporters, European Union countries, Morocco and Palestine do not face any tariffs for their exports into most EU countries. EU countries, however, encountered tariffs on their exports to non-EU countries of between 30 and 36%.
- Lebanon, the other Mediterranean basin countries and American countries pay high tariffs on their exports to Europe (between 30 and 36%) but face zero or low tariffs on their exports to Arab countries and various countries in the different regions of the world.
- Compared to Palestine and Morocco, Lebanon has a clear disadvantage when it comes to tariffs, as the former countries face much lower tariffs for entering the European market. Lebanon has a slightly comparative advantage in tariffs compared to Tunisia, Turkey and Syria given the slightly lower tariffs it pays for its olive oil exports into Europe (30.5% compared to 32.5% by Turkey and 35.8% by Tunisia for example).
What are the Trends in Trade in the 20 Largest Importing Markets?
The global value of olive oil imports witnessed a 1.6% growth from 2016 until 2020 while worldwide quantities increased by 16% for the same period. This highlights a global decrease in the unit price of olive oil which is likely reflecting the olive oil market dynamics of an abundance in supply matched by higher levels of production.
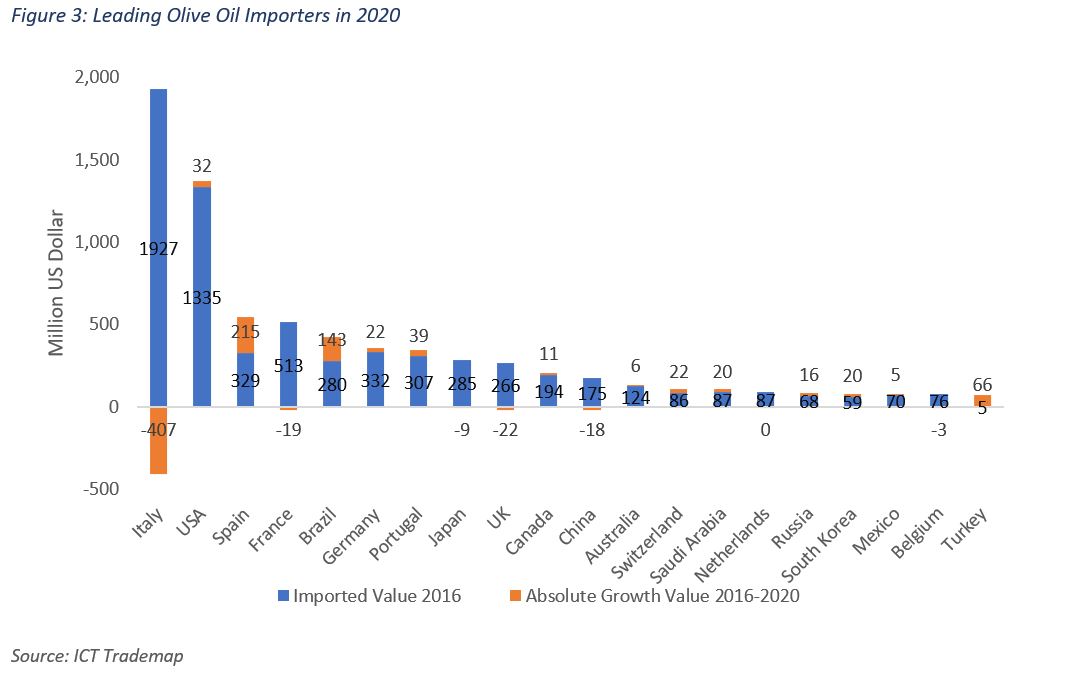
The top 20 olive oil importers accounted for around 90% of worldwide imports in 2020. For the past two decades, Italy remained the leading olive oil importer with a 20% share of total olive oil imports in 2020. Since 2016, the value of its olive oil imports decreased by 21% while the quantity imported increased by 25%. The average unit price of Italian olive oil imports decreased by 37% from $6,079/ton in 2016 to $3,848/ton in 2020.
Meanwhile, the United States retained its second place, over the same period, with a share of 18% in 2020 with a slight increase in import value and almost double the imported quantity between 2016 and 2020. Spain had recently overtaken France, coming in third place with 2020 shares equivalent to 7% and 6% respectively.
Another remarkable increase is observed in Turkey with the value of olive oil imports increasing by more than thirteenfold and the quantity by more than 31 times. The increase in the imports of Brazil over the last 5 years made it the 5th largest importer of olive oil in 2020. While the value of olive oil imports by some leading importers decreased, quantities imported maintained an upward trend implying a decrease in unit price.
What Are Interesting Markets for the Future?
Global olive oil consumption has almost doubled in the last three decades. While traditionally consumption of olive oil was mostly concentrated in producing countries, it has also been on the rise in non-producing countries in recent years. Still, in 2018 the top 10 countries by per capita consumption of olive oil consisted of only Mediterranean countries. The consumption per capita in these countries ranged from 2.8 litres in Libya (#10) to 12.8 litres in Greece (#1). The large gap with other countries is best illustrated by the per capita consumption of 1.4 litre, 1.2 litre, 0.7 litre and 0.4 litre in Canada, Saudi Arabia, Germany and Brazil respectively.
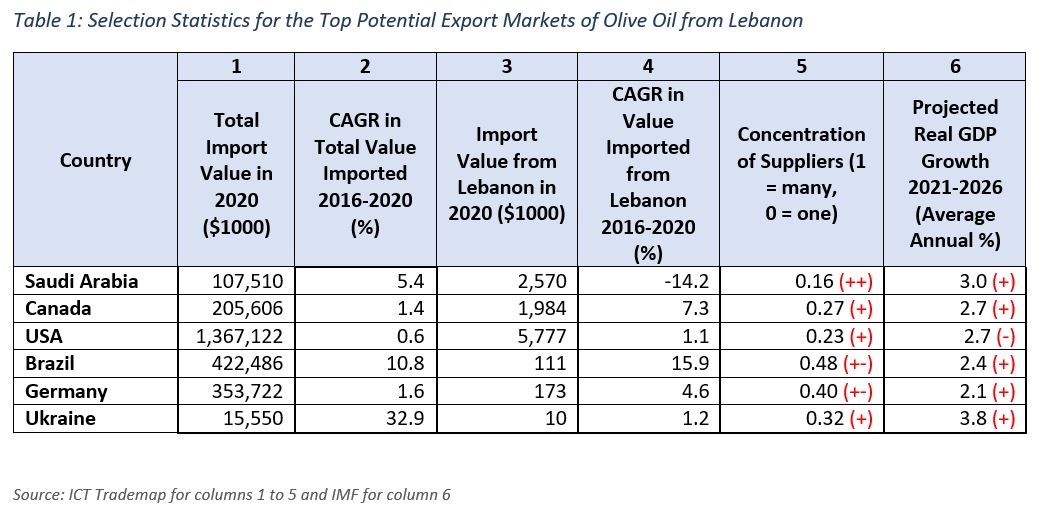
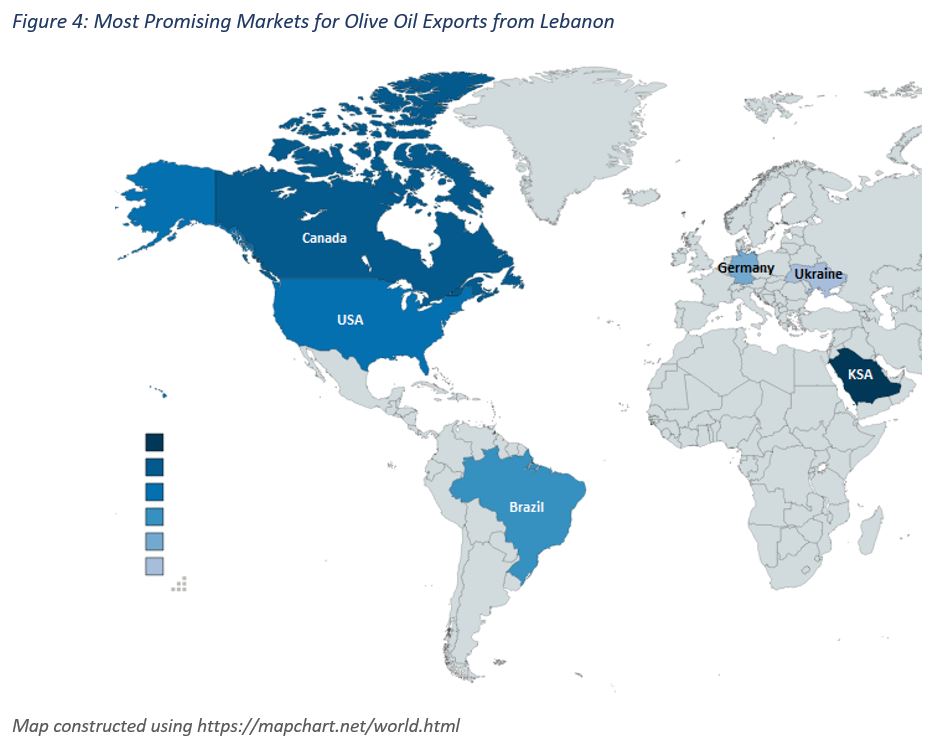
Overall, the conclusion is that there is much room for growth of worldwide olive oil consumption, in particular in the countries without an olive oil tradition. Following a model based on trade statistics and other variables, Saudi Arabia, Canada, United States of America, Brazil, Germany and Ukraine were identified as potential markets for olive oil exports from Lebanon (Figure 4).
While Saudi Arabia, Canada and the United States of America are among the top importers of Lebanese olive oil with a share of more than 45% in 2020, each of the other three countries imported less than 1% of the exported Lebanese olive oil. The methodology includes a calculation based on total olive oil import value in 2020 and its growth in the previous 5 years, import value of olive oil from Lebanon in 2020 and its growth in the previous 5 years, tariffs faced by Lebanon compared to those faced by leading competitors in the market, concentration of suppliers, and projected average growth in GDP in the period 2021-2026 (Table 1).
Markets with Highest Export Potential


Tips
- Focus your marketing and sales efforts on a limited range of countries, ideally in one region.
- Study your export market to understand its requirements and the needs of the buyers.
- Identify your competitors to potential customers in order to differentiate your product.