Market: Trade Statistics, Trends
Production, Consumption and Exportation Trends
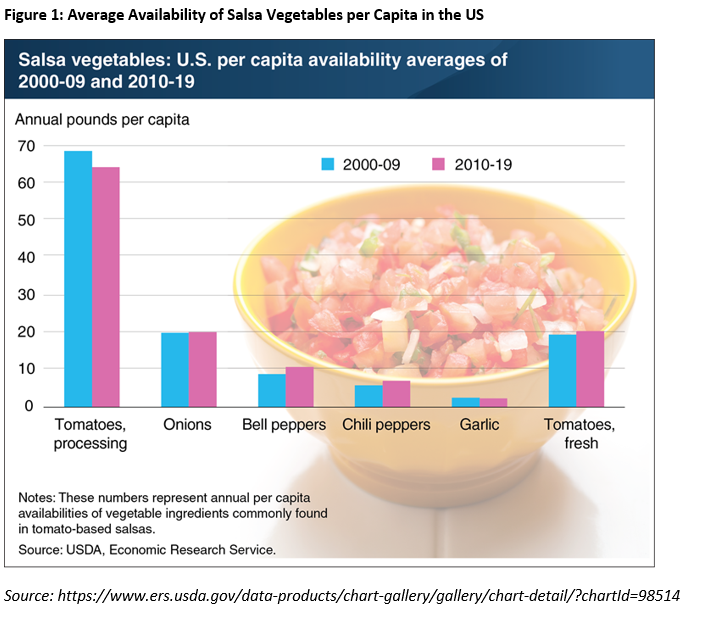
Salsa, in its various forms, is ranked among the top condiments sold in the U.S. as the consumer’s demand has been gradually increasing over the years, particularly for the traditional sauces such as Ketchup and Mayonnaise. This demand has been driven by growing appetite for the Hispanic cuisines which refers to Mexican food, Spanish dishes, Central American and Caribbean countries recipes. Moreover, the rising income is another trigger of this market stipulation.In the U.S., Salsa term refers to red colored tomato-based sauce made up of vegetable or fruit like onions, garlic and peppers. The per capita supply of these popular ingredients for Americans reached 129 pounds (~58.5 kg) in 2019, which is a substantial amount being used in salsas. It’s worth mentioning that the available processed tomatoes is 65 pounds (29.5 kg) per capita, which is 3 times higher than the available fresh tomatoes.
Average availability per capita of fresh tomatoes salsas has recorded higher growth between 2010-2019 compared to 2000-2009 (figure 1), indicating a shift of consumer behavior towards fresh-based products that are considered as healthier choices than the processed ones.
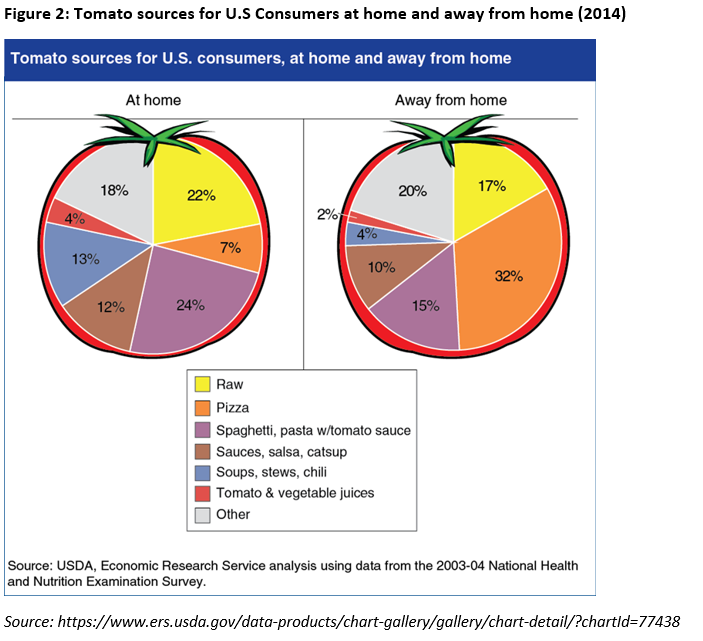
In 2014, the ERS researchers analyzed the U.S. consumption of vegetables and have concluded that over three-quarters of it is used in sauces and mixed foods like pasta sauce . Spaghetti, pasta and other mixed sauces dominate the tomato consumption in homemade food with 24% of total tomato sources, followed by raw tomato which contains less sodium and calories. As for the away from home, pizza is the largest tomato sauce with 32% of total tomato consumption (figure 2).
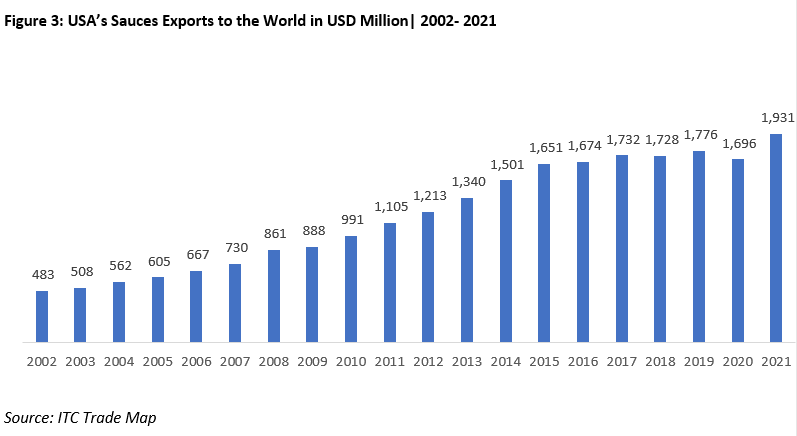
The U.S. exports of sauces to the world has been increasing between 2002 and 2021 at a CAGR of 7.6%, reaching a record of USD 1,931 million (figure 3). Main exported sauces are preparations for sauces and prepared sauces, mixed condiments and seasonings (such as mayonnaise, salad sauces, mixed seasonings among others) (76%); tomato ketchup and other tomato sauces (16%); soya sauce (4%); and mustard flour and meal whether or not prepared and mustard (4%) . As for their destinations, the aforementioned are exported to Canada (36.3%), Mexico (16.8%), Chile (3.7%), Japan (3.3%) and Saudi Arabia (3.3%), receiving over 50% of total U.S sauces exports .
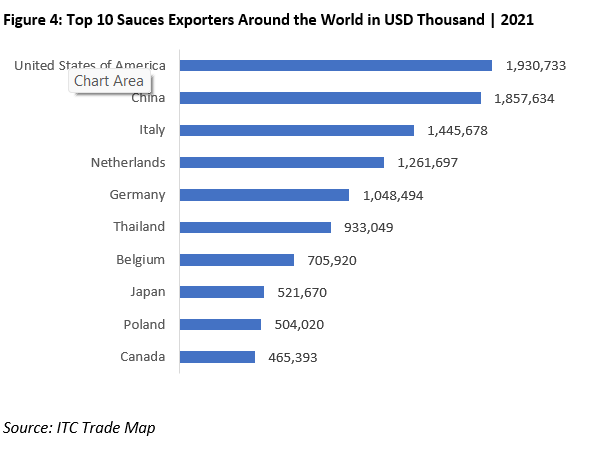
China is one of the main competitors in the sauces market for the U.S. along with Italy, Netherlands, Germany and others (figure 4). The sauces, dressings and condiments market is ranked one of the high potential products for growth in the Chinese market during the upcoming years .
Import Trends
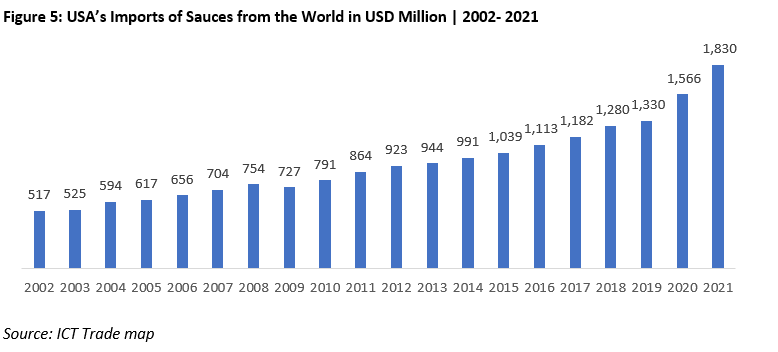
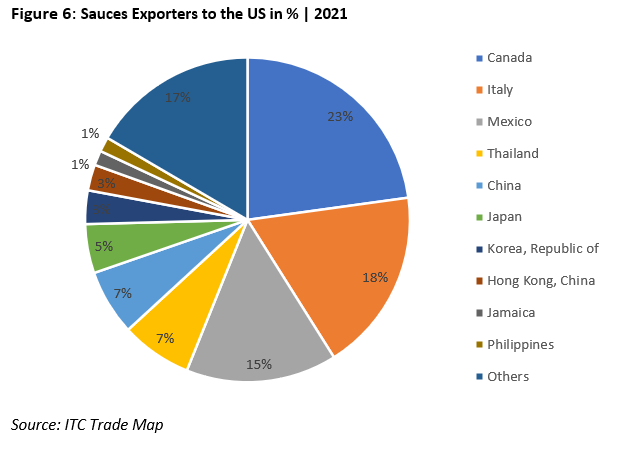
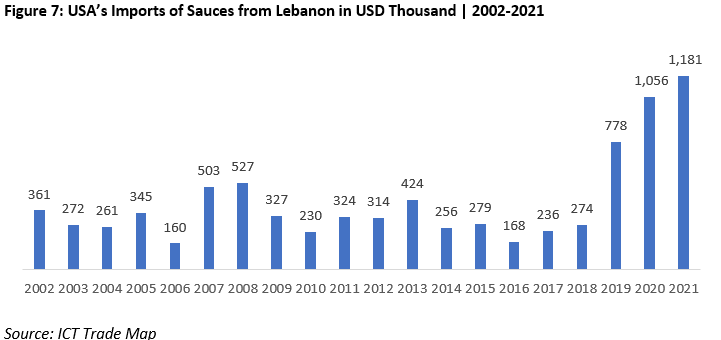
Although the U.S. is one of the main exporters of sauces worldwide, the country’s exports have increased gradually over the years, from USD 517 million to USD 1,830 million between 2002 and 2021 indicating a growing demand for this product (figure 5). The main suppliers of sauces for the U.S. in 2021 are Canada (23%), Italy (18%), Mexico (15%), Thailand (7%) and China (7%) (figure 6).Lebanon’s exports to the U.S. have been fluctuating over the years until 2019 when the exporting has become a pressing need, that is crucial to survive the local financial and economic crises. Lebanese sauces exports have hit record high of USD 1,181 thousand in 2021, 52% higher than the exported amount in 2019 (figure 7). Moreover, during the last years, the country’s awareness to export to the U.S. has increased with the total exports to the states growing at a CAGR of 49% between 2019 and 2021 .
As per the ITC trade map, Lebanon has an untapped potential for tomato ketchup and other tomato sauces exports of around USD 32 thousand, as for the exports of preparations for sauces and prepared sauces, Lebanon has surpassed its potential which is USD 611 thousand .
Share of Imports and Unit Price in 2020
The sauces market includes a wide range of products with different base ingredients. Based on the Vegetables and Pulses outlook (November 2021), the producer price index for tomato catsup and sauces has increased 4.1% from the 4th quarter of 2020 to the same quarter in 2021.Table 1: Processed vegetables: U.S. Producer Price Indices, 2020–21 2020 2021 4th Q Change (%) 1st Q 2nd Q 3rd Q 4th Q 1st Q 2nd Q 3rd Q 4th Q (f) Quarter Year PPI for Tomato catsup and sauces 161.1 160.5 159.6 161.7 162.4 163.0 164.0 168.3 2.6 4.1 Source: https://www.ers.usda.gov/webdocs/outlooks/102665/vgs-367.pdf?v=6888.5
The value of both, sauces exports and imports have increased over the years, at a CAGR of 1.8% and 1.4% respectively between 2012 and 2021. However, the import value in thousand USD per ton remains slightly higher than the export unit value in 2021 of around 6%.
Table 2: Trade Value in Thousand USD per Ton of Sauces (HS 2103) (2012-2021) 2012 2013 2014 2015 2016 2017 2018 2019 2020 2021 Import Value in USD/Ton 1.881 1.899 1.972 1.927 1.911 1.981 1.988 1.950 1.998 2.136 Export Value in USD/Ton 1.718 1.741 1.714 1.682 1.685 1.728 1.854 1.891 1.928 2.014 Source: ITC Trade Map
Changes in the American Market
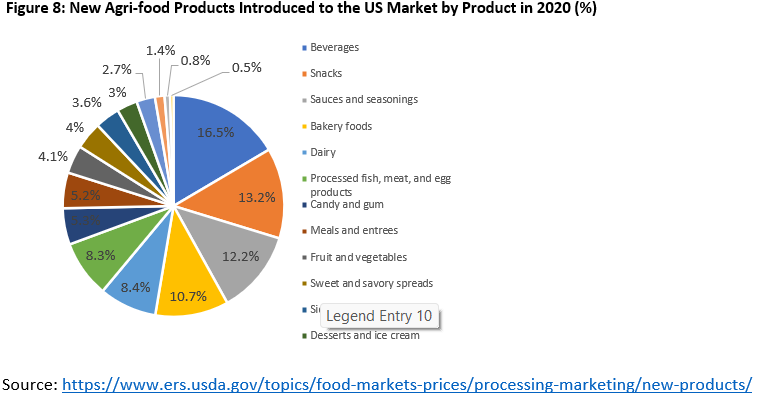
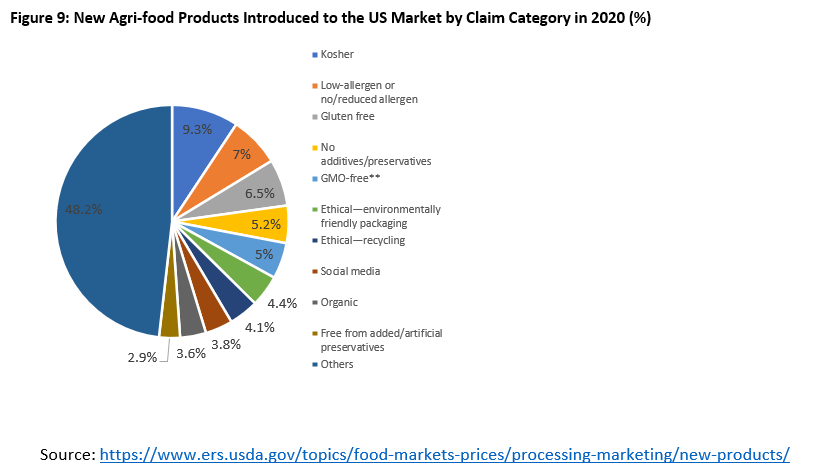
In 2020, sauces and seasonings ranked among the three top categories with new products along with beverages and snacks, all contributing to 41.9% of total products newly introduced to the U.S. market. It’s worth mentioning that these 3 products were in the top 5 products during the 2015-2020 stint. This indicator highlights the high level of innovation in the sauces and seasonings market, accounting for 12.2% of total new products in the U.S (figure 8).Top claims for these categories are kosher (9.3%), low allergen or no/reduced allergen (7%), gluten free (6.5%), no additives/preservatives (5.2%), GMO-free (5%), ethical-environmentally friendly packaging (4.4%), ethical recycling (4.1%), social media (3.8%), organic (3.6%) and free from added/artificial preservatives (2.9%) (figure 9). These categories are the new emerging food trends in the U.S. market, thus touting your products under any of this category will help you reach out to higher number of consumers.
One of the foremost changes in the U.S. market is that children are heading towards healthier choices, with less sweetened and sugary foods. As per the ERS’s loss-adjusted food availability data between 1994 and 2008, american kids are limiting their intake of sweeteners compared to adults . However, during the last years, the U.S. market has been shifting with a growing food awarness on healthier choices, natural food and enviromental impact, which is partially linked to the impact of the pandemic on the population’s attitude and consciousness.
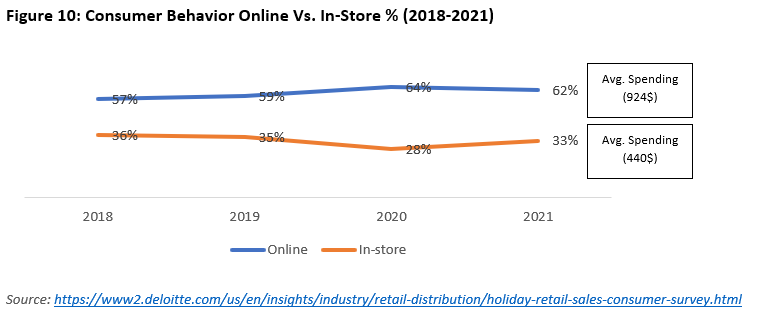
In terms of shopping behaviours, many changes have occurred since the start of the pandemic, mainly reflected in the consumer performance and purchase preferences with the increased health concerns and travel restrictions. However, trends are taking the lead towards digitalization, mainly online shopping and delivery to your doorstep. The COVID-19 crisis has speed up the technological inclusion of the different generations around the world especially that consumers have prioritized their wellbeing while purchasing any product. Based on the latest figures published by Deloitte from their annual holiday survey, the average online spending standing at USD 924 between 2018 and 2021 is double the average of in-store spending at USD 440 during the same period. Whilst the online spending has increased 5% between 2018 and 2021, the physical spending dropped by 3% (figure 10).
In light of these sharp drifts, any product targeting the US market should bring the consumer’s online experience to the fore, especially with the global expansion of the COVID-19 pandemic and its new variants. However, the importance of the e-commerce market will be emphasized in the market entry section (Check Section 2).
Beside the swelling preference for online shopping, consumers are focusing on their personal health and basic hygiene, which is manifested in the accelerated demand of organic, natural and fresh goods. As per Mckinsey’s report on “how COVID-19 is changing consumers behave across all spheres of life”, e-commerce, health and wellbeing are the main emerging trends in consumer’s behavior after the pandemic outbreak. Therefore, it’s highly recommended that you chase the newest trends and needs in terms of package, hygiene, health, organic, fresh and safety, especially when forging new partnerships in foreign countries.


Market Entry: Trade Channels and Segments, Selection of Channels
Several approaches exist to set your foot in the US market, all gathered into 3 different strategies:
- Directly selling to the client/customer (shipping to the end user without any intermediary, and therefore the exporter will be responsible for shipping the merchandise and collecting the money, unless they have another agreement).
- Indirectly selling through Export Intermediaries (distributor, buyers, brokers, agents…)
- Partnering with a company abroad that will facilitate access to the market which will reduce major expenses as the producer will leverage from the existing partner’s resources. Another opportunity could be establishing a business presence in the US market, such as a commercial hub or marketing office.
However, in terms of distribution channels, any producer willing to enter an international market should evaluate its product, experience, company size and resources. In addition, understanding the different distribution channels should be his primacy as this will determine his position in the new market.
It’s worth mentioning that since 2009, the U.S. retail channel is depending more on distributors in order to reduce their workload in terms of invoices, papers and reach further discounts. According to the National Association for the Specialty Food Trade Inc. (NASFT), more than 180,000 specialty food products are available in different selling stations including supermarkets, specialty food stores, natural food products, corner shops, retail outlets and drugstores.
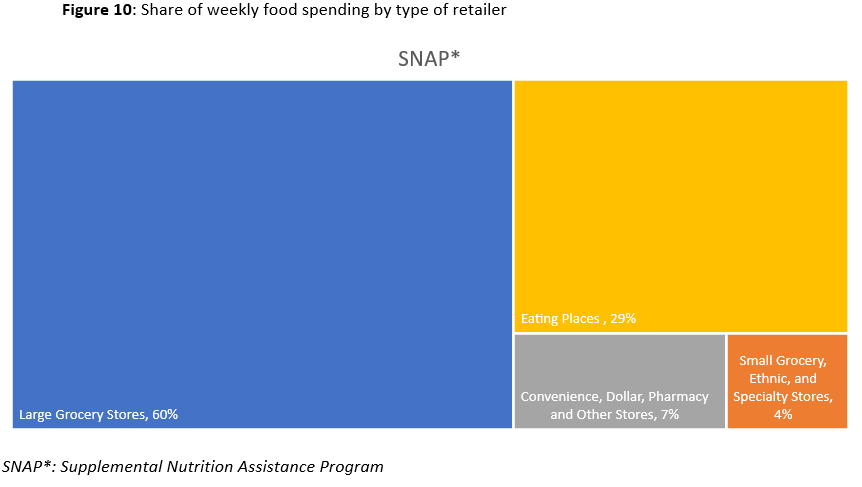
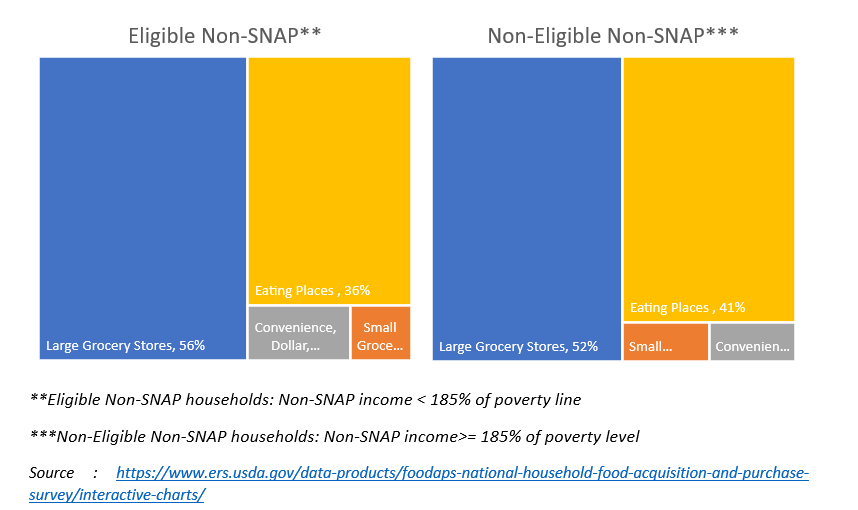
- Main Supermarket Chains: The US food and beverages retail sector is well-established and diversified, including hypermarkets, supermarkets, corner shops, specialty food stores, food markets, and other retail outlets. Large grocery stores are leading the market with a range of 52% up to 60% of weekly food spending, followed by eating places (figure 10). Major grocers in the US include WALMART INC, THE KROGER CO., ALBERTSONS COS. INC., AHOLD DELHAIZE USA, PUBLIX SUPER MARKETS INC. H.E. BUTT GROCERY CO., MEIJER INC., WAKEFERN FOOD CORP., ALDI INC., WHOLE FOODS MARKET. Based on Statista’s latest figures, Kroger Co. is the leading supermarket in the US with its retail sales amounted at USD 131.57 billion in 2020 and the second biggest retailer after Walmart.
- E-commerce: Recently, American consumers are heavily relying on online grocery shopping with the current unprecedented health crisis, recording 17-percentage-point surge . Online shopping is forecasted to grow in the upcoming years, to reach around USD 60 billion sales by 2023. Top e-commerce stores in the US Food & Beverages industry in 2020 in terms of net sales comprise Kroger.com (USD 4,687 million), followed by Walmart.com (USD 3,289 million) and Amazon.com (USD 2,643 million), Freshdirect.com (USD 830 million) and others .
Finding Potential Buyers
- Brokers/Export Mediators: These export intermediaries will assess and evaluate the company’s products to access the US market by providing them with consultancy and guidance, and ensure a wide exposure to buyers, distributors, industry’s professionals, associations, related businesses along the entire supply chain, and other potential stakeholders and connections. It will facilitate market entry, ease access to compliance procedures and provide needed information to create business deals. This will be the first stage for any company to enter the US market.
- International Fairs and Exhibitions: The participation in international fairs and exhibitions while targeting B2B meetings is identified as a priority to find potential buyers. Various projects are being implemented in Lebanon under international, non-governmental and public entities to increase the marketing exposure of Local manufacturers at overseas trade shows. The support comprises sponsoring and organizing the participation of Lebanese SMEs that are already exporting or willing to export in leading international fairs and exhibitions, an opportunity to meet buyers, build connections and go international. The Investment Development Authority of Lebanon (IDAL) covers part of the exporters’ participation fees in key international fairs that are beneficial for Lebanese exporters. However, the Productive Sectors Development Programme (PSDP) is currently providing institutional support for IDAL in order to achieve its export support activities. It’s worth mentioning that being members of any of the following entities will help you to exhibit your products in international fairs: Association of Lebanese Industrialists (ALI), Qoot Cluster (Berytech), Fair Trade Lebanon (BIEEL Initiative) and Oxfam. For more info on the list of fairs and exhibitions check Section 4.
- Other Indirect Connections: e-commerce platforms are thriving in the US, especially after the boom induced by the pandemic. Amazon, eBay, Alibaba, Walmart and others offer several options to distribute your product by either distributing it directly to consumers or receiving orders and the seller will be responsible for shipping their orders. In addition, connecting with the Lebanese diaspora could be another way to reach out to importers in the US who are from Lebanese origin and bringing Lebanese products to the country.
For the list of buyers, importers and distributors check ANNEX 1
Export Promotional Activities
Your marketing strategy should be set on specific aspects to highlight your product’s innovation and quality standards as well as to reach the relevant audience. For example, advertising your organic sauces require different promotional techniques than the traditional ketchup. Nonetheless, standard export promotional activities include the participation in international fairs and exhibitions, local trade and business events and strong presence on social media as well as other innovative techniques that highlight the specialties of your product. As mentioned before, partnering with local business company will help you in your marketing strategy due to their high level of expertise in the market. The series of marketing activities comprise:
- Traditional Marketing Campaigns (newspapers, TV and radio)
- Point-of-sale Displays
- International Exhibitions/Fairs
- Digital Marketing and social media
- Local Festivals and Tasting Events
- Restaurants and Food Services
Several food and beverage trade fairs have shown success in the US, bringing together all industry professionals, retailers and connections such as Fancy Food Show, Sweets and Snacks, SIAL America, America Food and Beverage Show and others. For the list of exhibitions and fairs taking place in the US, check the US Department of Agriculture website, as for shows around the world, check the list of Agriculture and Food Trade Shows published on the website of the government of Canada, including the US events. Moreover, you can always benefit from the expertise of a local advertising agency to market your products such as ExportUSA by attending practical, technical and hands-on trainings offering knowledge in the export field including market opportunities, market trends, legal requirements, finding agents/brokers, distribution channels and others.
As for social media platforms and online marketing, sauces companies should have a strong presence to generate deals and reach out to new consumers. However, digital marketing is one of the most efficient ways to promote your product including search engine optimization and paid ads on the most popular social media platforms like Facebook, Instagram, Twitter and LinkedIn. You’ll have to stay updated on all new trends on these platforms and creative in terms of posts and content. Furthermore, all your online platforms should be relatively related and linked to help consumer access your products/services.
Few suggestions on how to reach out to new consumers on social media:
- Youtube (the most popular media platform in the US): popular Youtube channels and paid ads
- Facebook (the second largest platform in the US): sponsored ads and influencers accounts might be efficient to advertise your products
- Instagram: sponsored posts, food accounts and influencers (like Deliciously Ella, Fit Men Cook and Gimme Some Oven)
- Food Blogs such as Serious Eats and The Recipe Critic
- Pinterest with more than 60% of its user are women
- LinkedIn to promote your business and products (using ads, account upgrade and analytics)
Social media platforms are taking the lead in advertising new products, leaving behind the traditional media outlets such as TV ads and flyers. The focus on the advertising on social media platforms has generated substantial benefits for both parties, producers and customers including better and direct interaction. U.S. companies are promoting their company’s websites and social media platforms through a QR code on their products which provides a direct access to their digital services. Moreover, companies can promote their product’s main specifications such organic, sugar free among others. Products with social media logos ranked among the top 8 new product claims (refer to figure 9), accounting for 3.8% of the total U.S. new products in 2020 . Therefore, companies are becoming more aware of the social media importance and their digital marketing strategy as an essential tool to sell their goods.
It’s worth noting that the advertising industry in the US is regulated by several public and private entities including Federal Trade Commission (FTC), Bureau of Consumer Protection, Federal Communications Commission (FCC) and Food and Drug Administration (FDA). In order to ensure that all your advertising campaigns abide by the rules and laws, it’s advised to consult with an expert in the US market or a US-based advertising company.
Doing Business: Business Culture
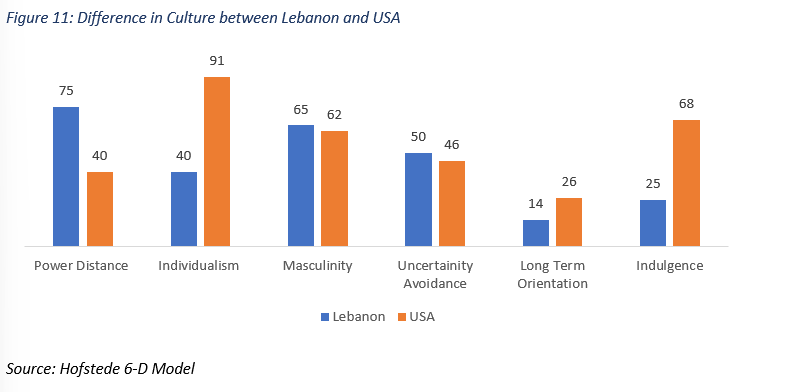
Six main culture-related dimensions have been identified by Geert Hofstede and other experts for societies to arrange and shape its structure. However, cultural behaviors and attitudes differ between societies, and even within one society, not all people act the same way. Nonetheless, common manners are detected between the society members and reflected in the dimensions below:
Power Distance: the extent to which the less powerful members of institutions and organizations within a country expect and accept that power is distributed unequally.
There is a large gap in the score of Lebanon and the US on power distance. While Lebanon follows a hierarchical and centralized system, the US emphasizes the uniqueness of the individuals which leads to power inequalities.
Individualism: the degree of interdependence a society maintains among its members.
While Lebanon scores low on individualism reflecting its collectivistic society, the US follow the “Liberty and Justice for all” principle as one of the most individualist countries worldwide. This is manifested by ensuring equal rights for American citizens as well as government. Within the work environment, information is circulated between the team, from employees to managers as they are both being consulted for their knowledge and expertise. However, employees are likely to be independent, self-efficient and create new initiatives. As for Lebanon, society members are related to their “group” whether their family or not, and therefore, handling responsibility for their group members.
Masculinity: whether society is driven by competition, achievement and success (masculine) or dominant values in society are caring for others and quality of life (feminine).
Both countries, Lebanon and the US score high on masculinity highlighting its masculine society. In the US, this behavior is combined with the individualistic culture. Americans work mostly on showing their success as winners in work and life as well not only on achieving their targets.
Uncertain Avoidance: the extent to which the members of a culture feel threatened by ambiguous or unknown situations and have created beliefs and institutions that try to avoid these.
Lebanon scored midway and thus, shows no clear preference. Nevertheless, the US scored low, below the average, undertaking innovative concepts, either a product or business idea and willing to accept them. It’s an open-minded community that encourages the freedom of speech.
Long Term Orientation: how every society has to maintain some links with its own past while dealing with the challenges of the present and future.
Both Lebanon and USA score low on long-term orientation indicating normative rather than pragmatic societies. People in both societies exhibit great respect for traditions, a relatively small propensity to save for the future, and a focus on achieving quick results. In the States, people are empirical and are affected by the “can-do” mind set. This is highly reflected in the business field, where Americans evaluate their work on a short-term basis including incomes and losses, leading workers to attempt achievements in short duration.
Indulgence: the extent to which people try to control their desires and impulses
Lebanon scores low on indulgence indicating a restraint culture, while the United States is ranked as an indulgent society with opposite perspectives. Restrained societies have a tendency to cynicism and pessimism. They have the perception that their actions are restrained by social norms and that self-indulgence is wrong. Restrained societies do not put much emphasis on leisure time and control the gratification of their desires. Although many campaigns have been launched against drugs in the US, the country is still facing a high rate of drug addiction under the concept of having a work-life balance. However, the US is considered as a proper/ puritanical society while many preachers show up on the TV as unethical.

Tips
- It’s crucial to enter the U.S. sauces market with new and different products in niche markets. The traditional dressings are already taken over by the biggest companies in the market.
- With the rising interest in ethnic market and multicultural cuisines, your product should have an identity that make it a Lebanese sauce with all the respect to the market’s requirements in terms of quality standards.
- Three American companies are dominating the sauces market: The Kraft Heinz Company, McCormick & Company, Inc., and Campbell Soup Co. However, other key players are competing in the market including General Mills Inc., Nestlé, ConAgra Food Inc., Unilever, Mars, Incorporated and its Affiliates, L.P. OTAFUKU SAUCE Co., Ltd .
- New trends in food consumption, heading towards healthier choices including low calories, gluten free, organic or vegan products. Categorizing your sauces under any of these brackets, will shift your sales records.
- Use eco-friendly packages, such as recyclable jars instead of using plastic or containers. You will hereby attract the eco-friendly community.
- When dealing with buyers, ensure an accurate delivery time in order not to lose any of your gains in the market
- Having one buyer is not considered as a good business practice. Better if you try to reach out to have several buyers so in case any of them stops, you will be able to maintain your export activities. However, ensure not have too many so you won’t be able to sustain your deliveries.
- Have a Well-Designed website with detailed information about your product specifications is crucial before reaching out to any buyer.
- Make sure to follow up with the buyers after attending fairs/exhibitions. Most of the deals will happen after the show.


