
Promising Markets For Grapes
Overview
Lebanese table grapes have a strong reputation for quality, flavour and taste, which gives you a valuable advantage in export markets. In 2024, Lebanon exported USD 28.5 million worth of table grapes, or 10,666 tons. The 30% growth in export value in 2024 is a positive sign and shows that there is still room for Lebanese exporters to expand and reach new promising markets.
Interestingly, Lebanon has a great opportunity to increase its market share in Europe and the GCC. This report provides an overview of Lebanon’s current production and exports of table grapes, its position in the international markets, and the available opportunities to enhance the country’s export potential with an overall aim of strengthening Lebanese exporters’ capacities and competitiveness.
Product Definition
Common commercially available table grape varieties such as Thompson Seedless and Flame Seedless are favoured by growers for their high yield and relative resistance to damage during shipment. Other less common varietals such as Cotton Candy, Kyoho or Pione are custom hybrids bred for size, appearance and specific flavour characteristics.
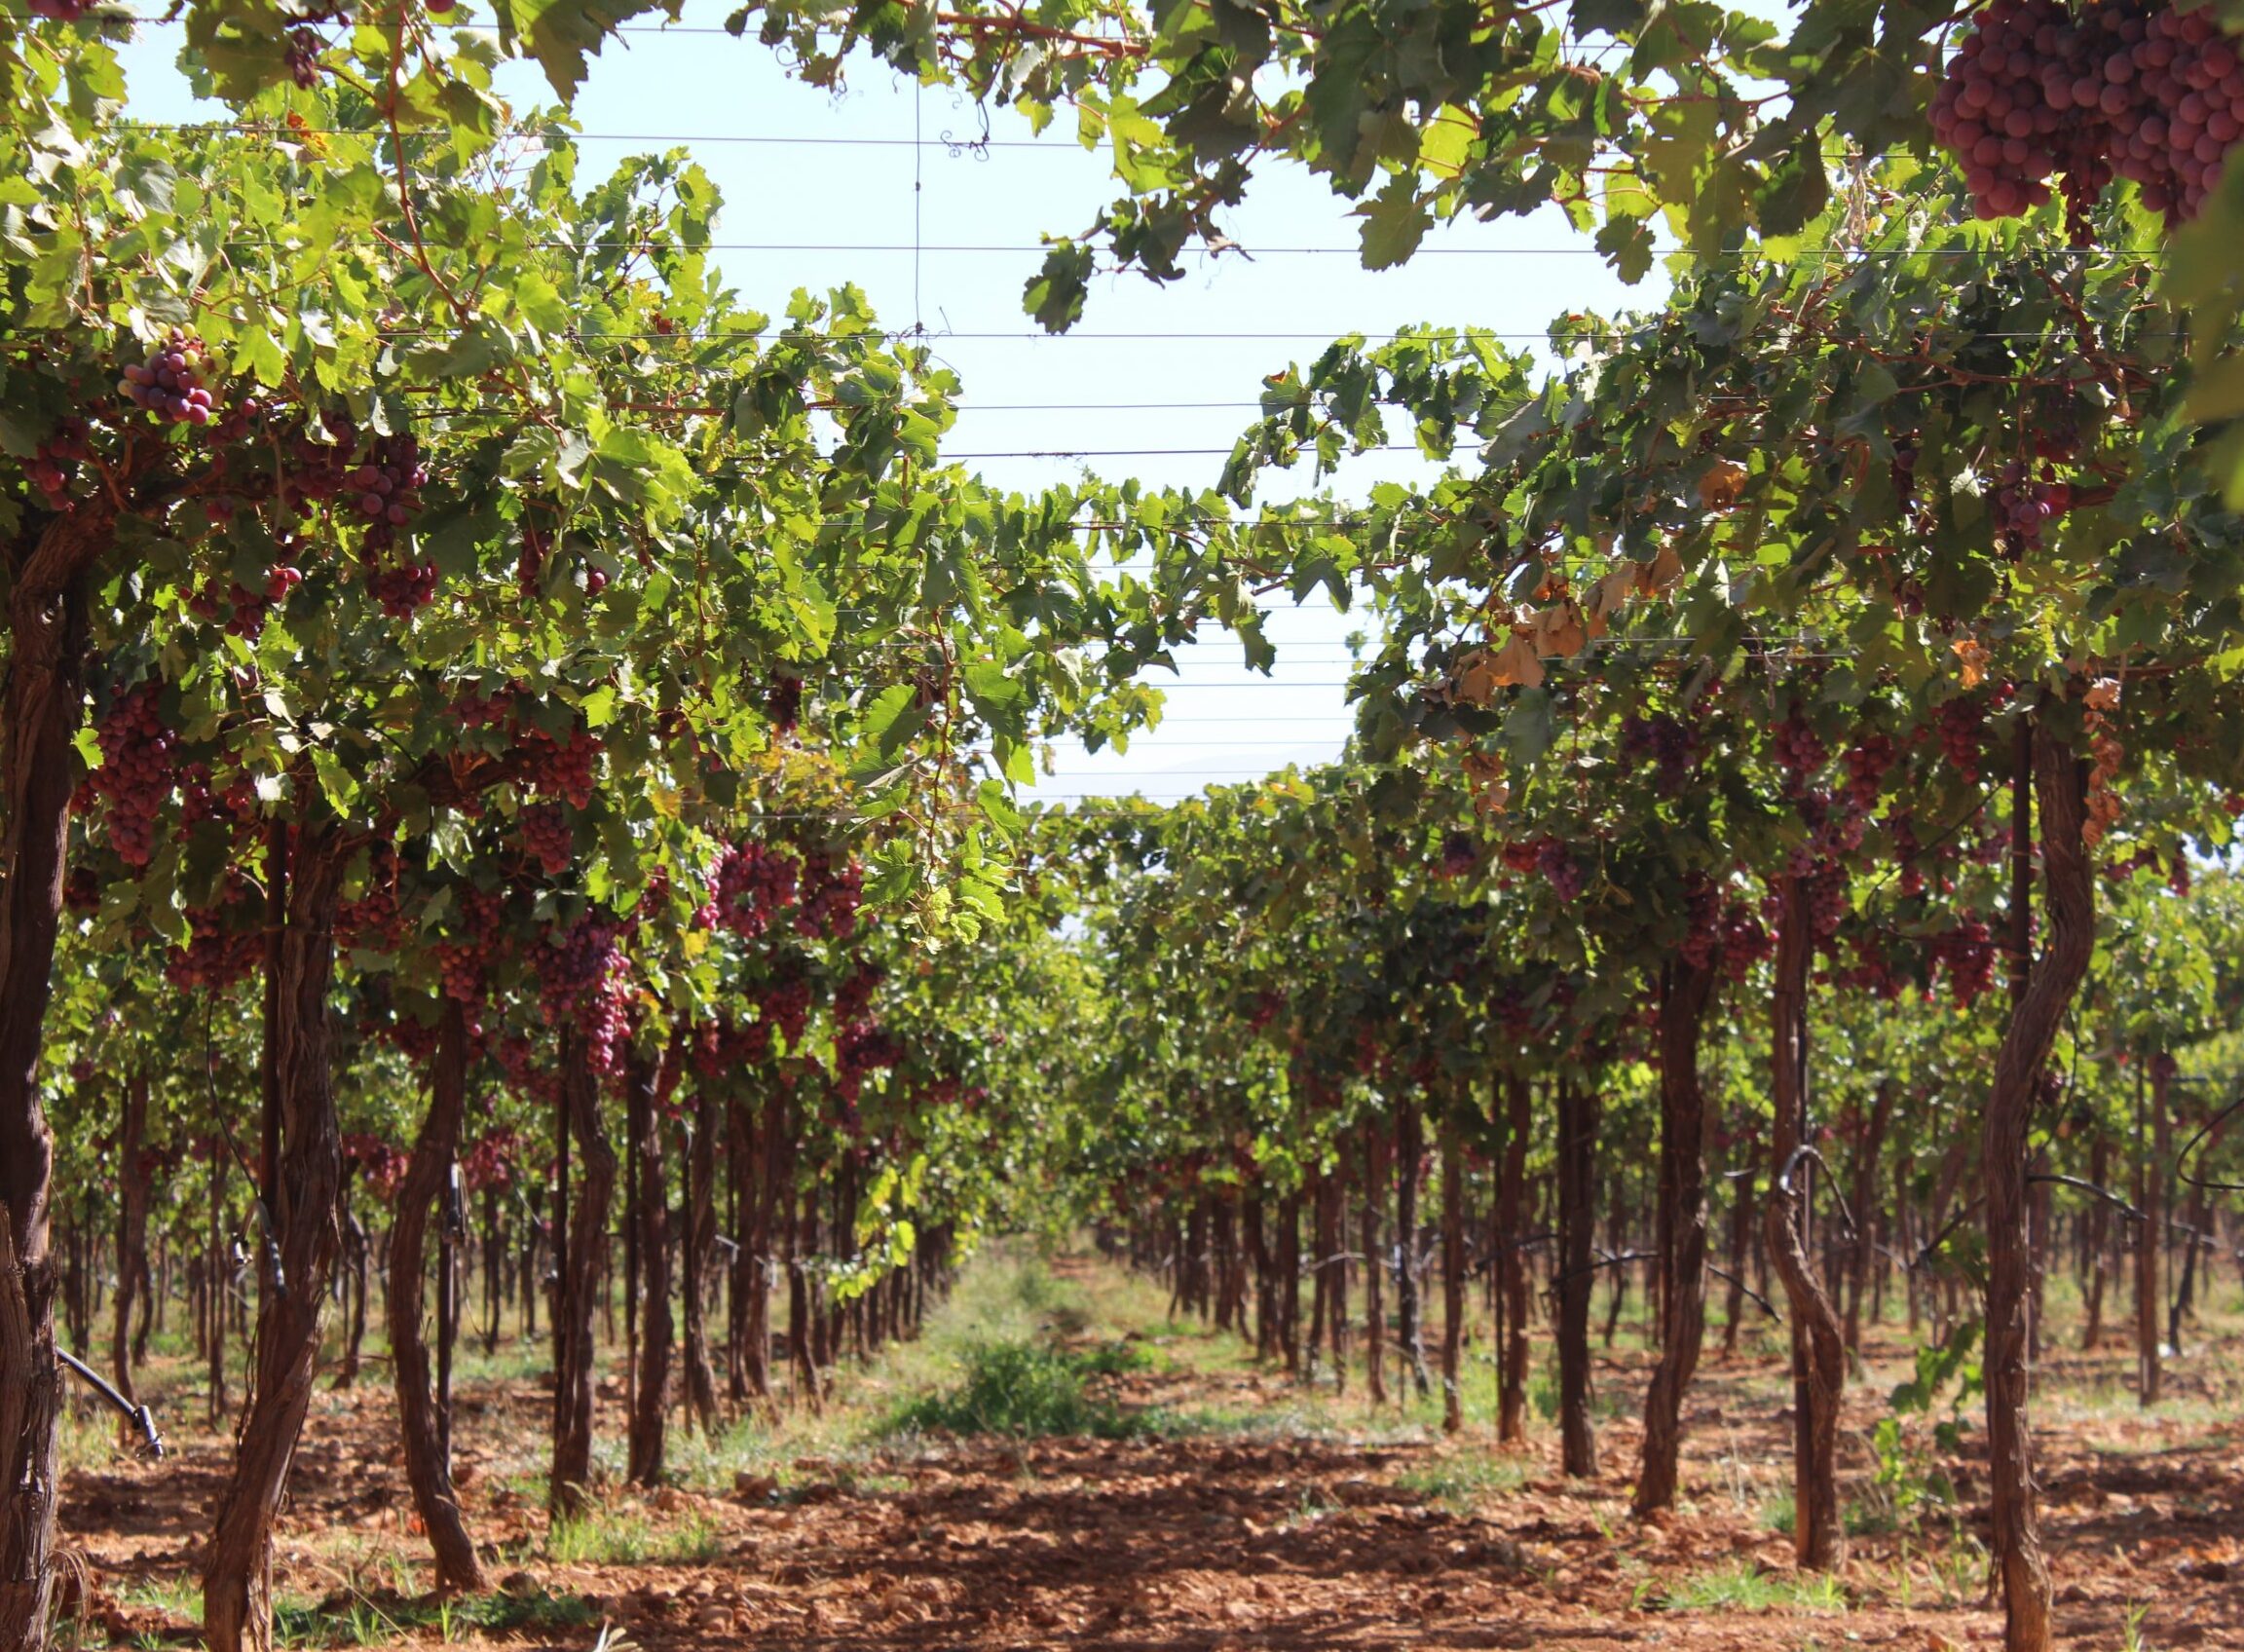
Delving into the Lebanese market, main table grapes varieties include Baytamouni, Tfeifihi, Maghdushi, Jbaai, Globe seedless, Early Superior seedless, Black Pearl, Red Globe. The most important areas of production are the Bekaa and Akkar where cultivation is facilitated by the local climate, including a long period of sunny days over the year, fertile soil and adequate averages of rainfall, which ensure the appropriate Brix degree. According to the Ministry of Agriculture, seasonal availability extends from June to February.
Where do Lebanese table grapes currently go to?
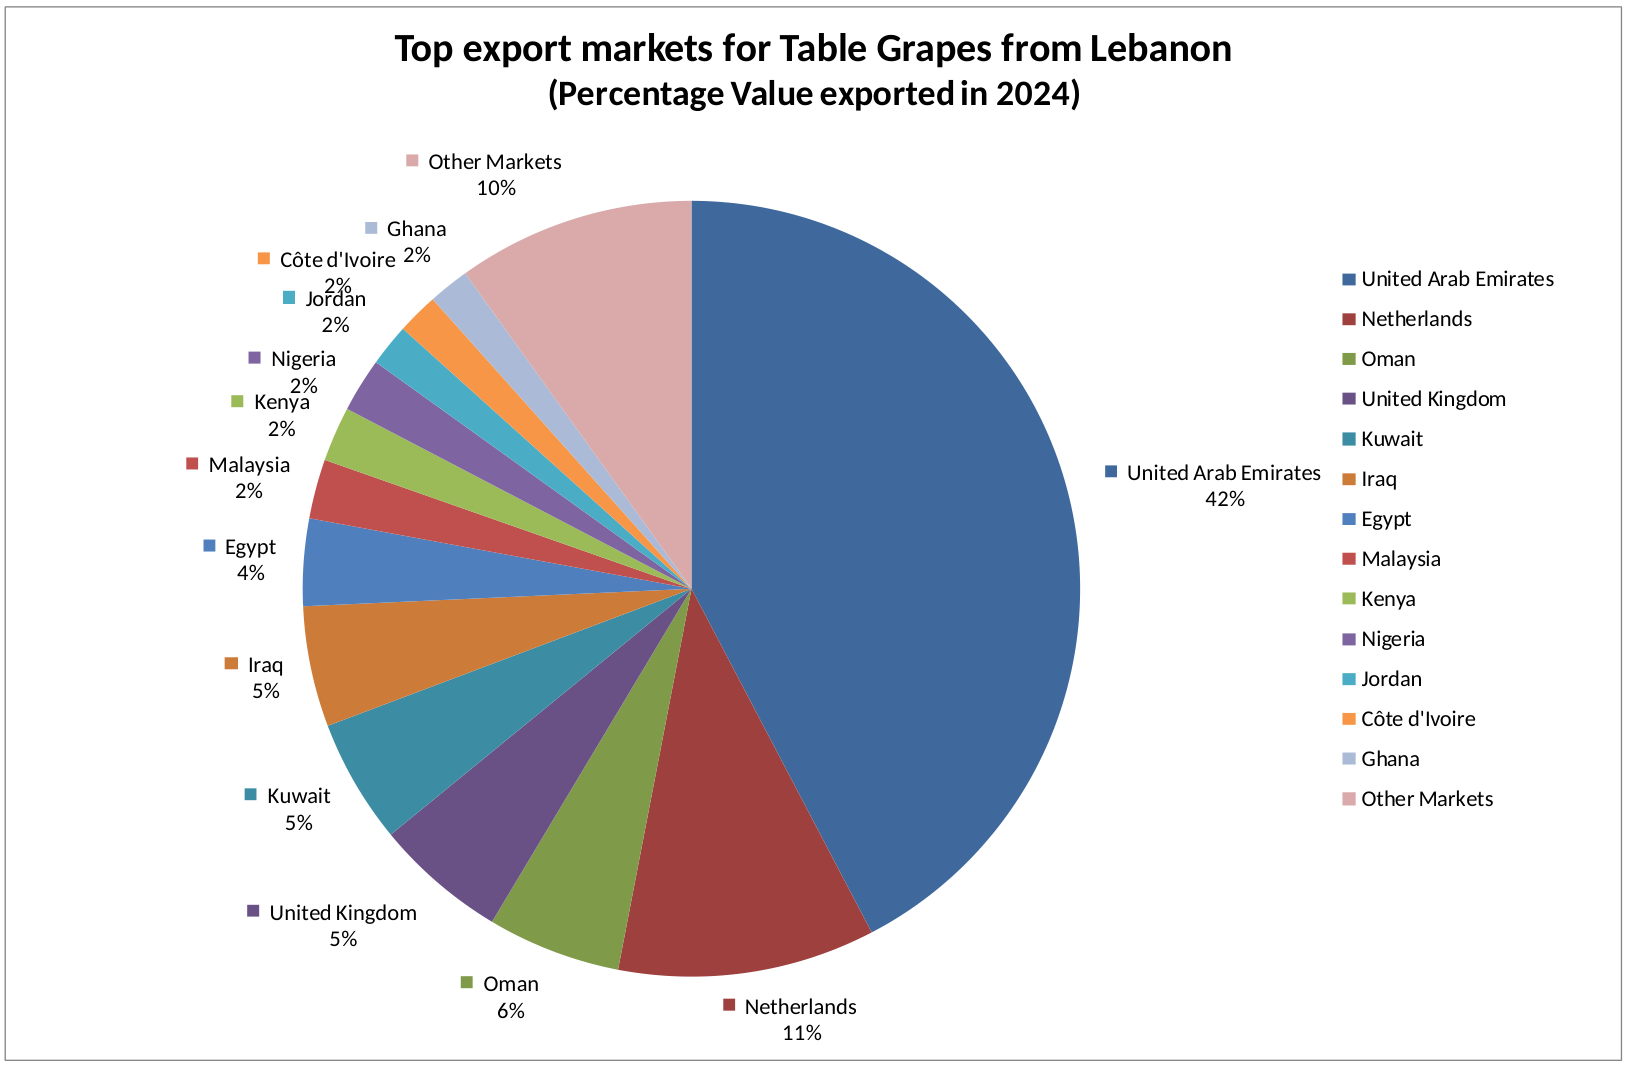
What is especially positive is that Europe is no longer limited to just small-scale entry. With the Netherlands and the United Kingdom ranking among Lebanon’s top destinations, there are clear signs that European markets can offer further growth opportunities. In other words, you can continue building on your strengths in regional markets while also looking ahead to expand into new, higher-potential export destinations.
Figure 1. Top export markets for Table Grapes from Lebanon in 2024 - Source: ITC Trade map
What is Lebanon’s position in the international market?
As shown in Figure 2, the leading global exporters of fresh grapes in 2024 were Peru (USD 1,705.2 million), Italy (USD 996.6 million), the Netherlands (USD 989.2 million), Chile (USD 938.1 million), China (USD 927.8 million) and the United States (USD 843.7 million). While the Netherlands ranks among the top exporters in value terms, it should be viewed primarily as a major European trade hub and re-exporter, rather than only as a producing origin. Lebanon exported USD 28.5 million in 2024, accounting for around 0.3% of world exports and ranking 26th worldwide among exporters of fresh grapes. Excluding major trade hubs, Lebanon’s position improves slightly, to around 25th place.
Largest Table Grapes Producers in the Mediterranean region
Among Mediterranean countries, Italy stands out as the leading exporter of fresh grapes in 2024, with exports valued at USD 996.6 million, followed by Spain (USD 467.2 million), Egypt (USD 293.1 million) and Türkiye (USD 133.6 million). By comparison, Lebanon exported USD 28.5 million. While Lebanon remains a relatively small exporter compared with these regional leaders, its presence in export markets shows that there is still room to strengthen its position further.
In table 1, the darker blue means it is a peak harvest month, whereas the clearer blue shows a slower harvest time.
As shown in Table 1, Lebanon’s table grape harvest season extends from June to February, allowing Lebanese exporters to remain present in the market during the winter months, when some nearby competitors are less active. This creates a potential export window especially in December, January and February. However, this window is not free of competition. South Africa is a major supplier to several European markets during this period, with particularly strong exports in January and February. Other off-season suppliers, including Peru and Chile, are also present in international markets during the northern hemisphere winter.
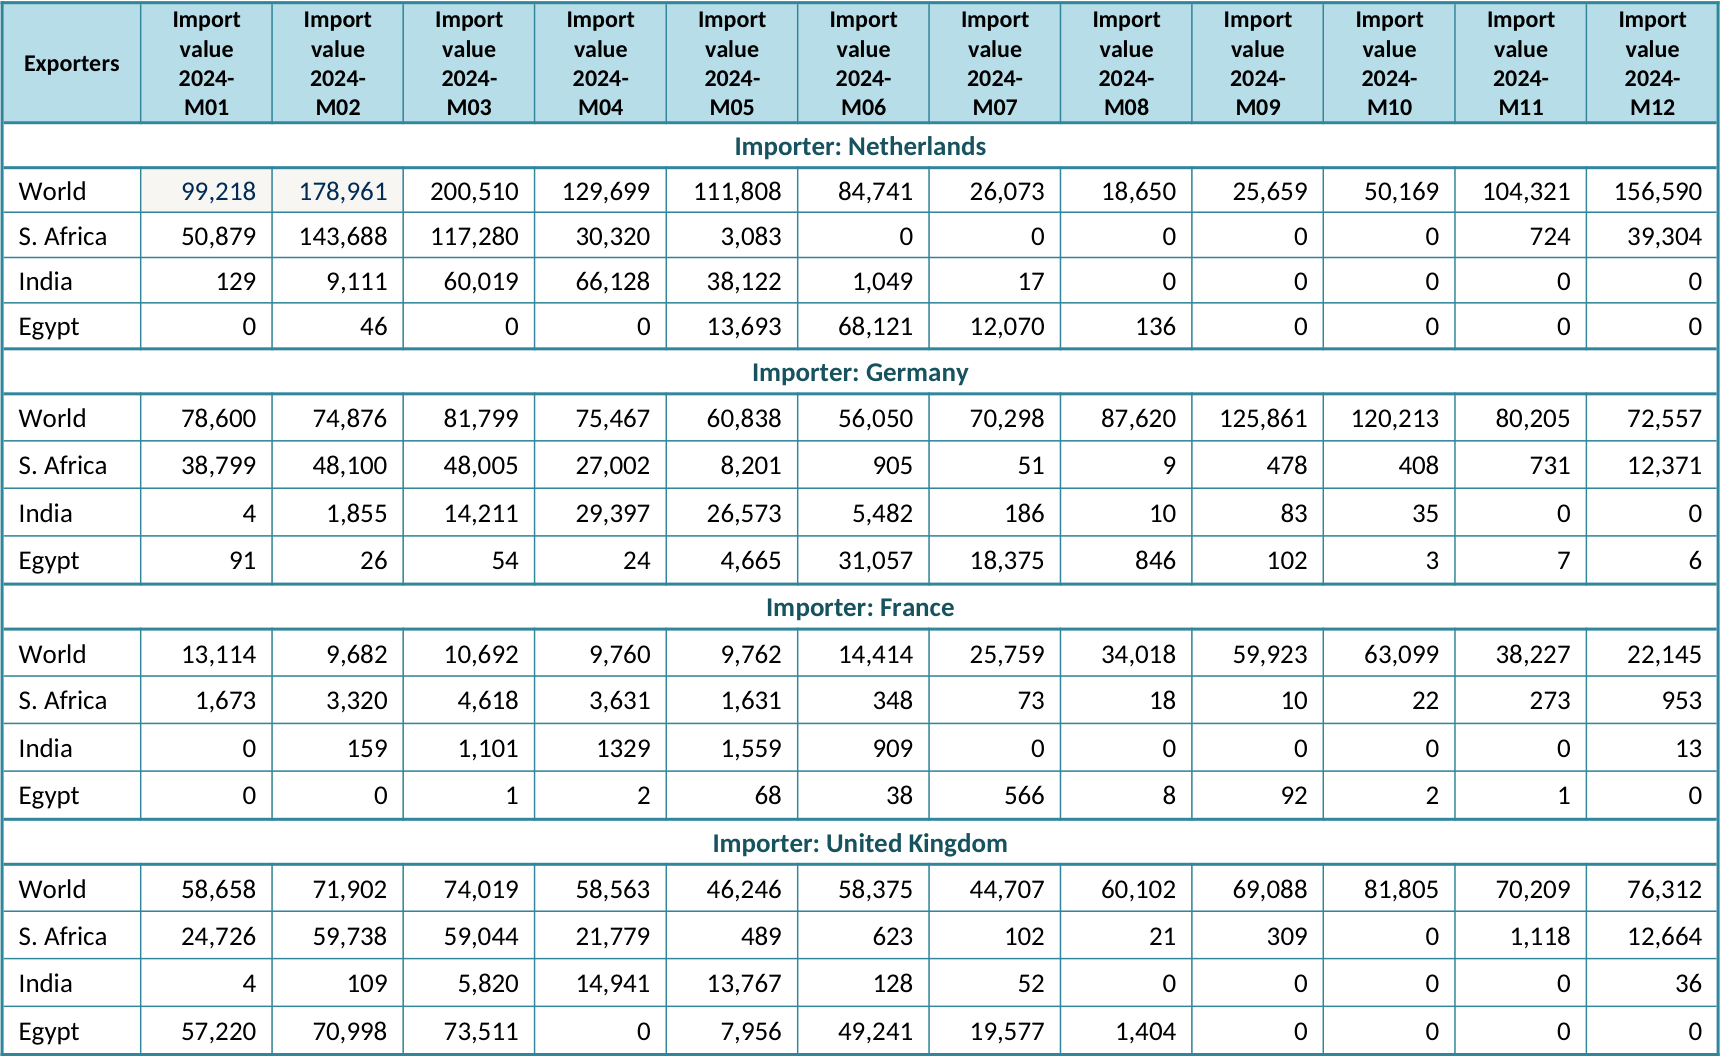
A closer look at Table 2 shows that some European markets appear more promising than others during Lebanon’s winter supply window. The Netherlands stands out mainly in December, and to a lesser extent in January, when supplies from India are very low or absent and imports from Egypt are negligible, although competition from South Africa remains strong. Germany also appears attractive in December and, to a lesser extent, January, when imports remain sizeable and supplies from India and Egypt are limited. Competition becomes much stronger in February as South African shipments rise. The United Kingdom offers its clearest opening in December, when Egyptian supply is absent and Indian volumes are minimal, while competition intensifies in January and February due to high shipments from both Egypt and South Africa. France appears to offer a smaller, more niche opportunity in December to February, when supplies from India and Egypt are almost non-existent, although the overall market size is more limited.
For Lebanese exporters, this means that the best opportunity in Europe is not broad-based across all markets and months, but rather depends on targeting the right markets at the right time. In practical terms, December appears to be the strongest entry point, especially for the Netherlands, Germany and the United Kingdom, while France may offer smaller niche opportunities through December to February.
Figure 2. Leading Exporters for Table Grapes 2024 - Source: ITC Trade map
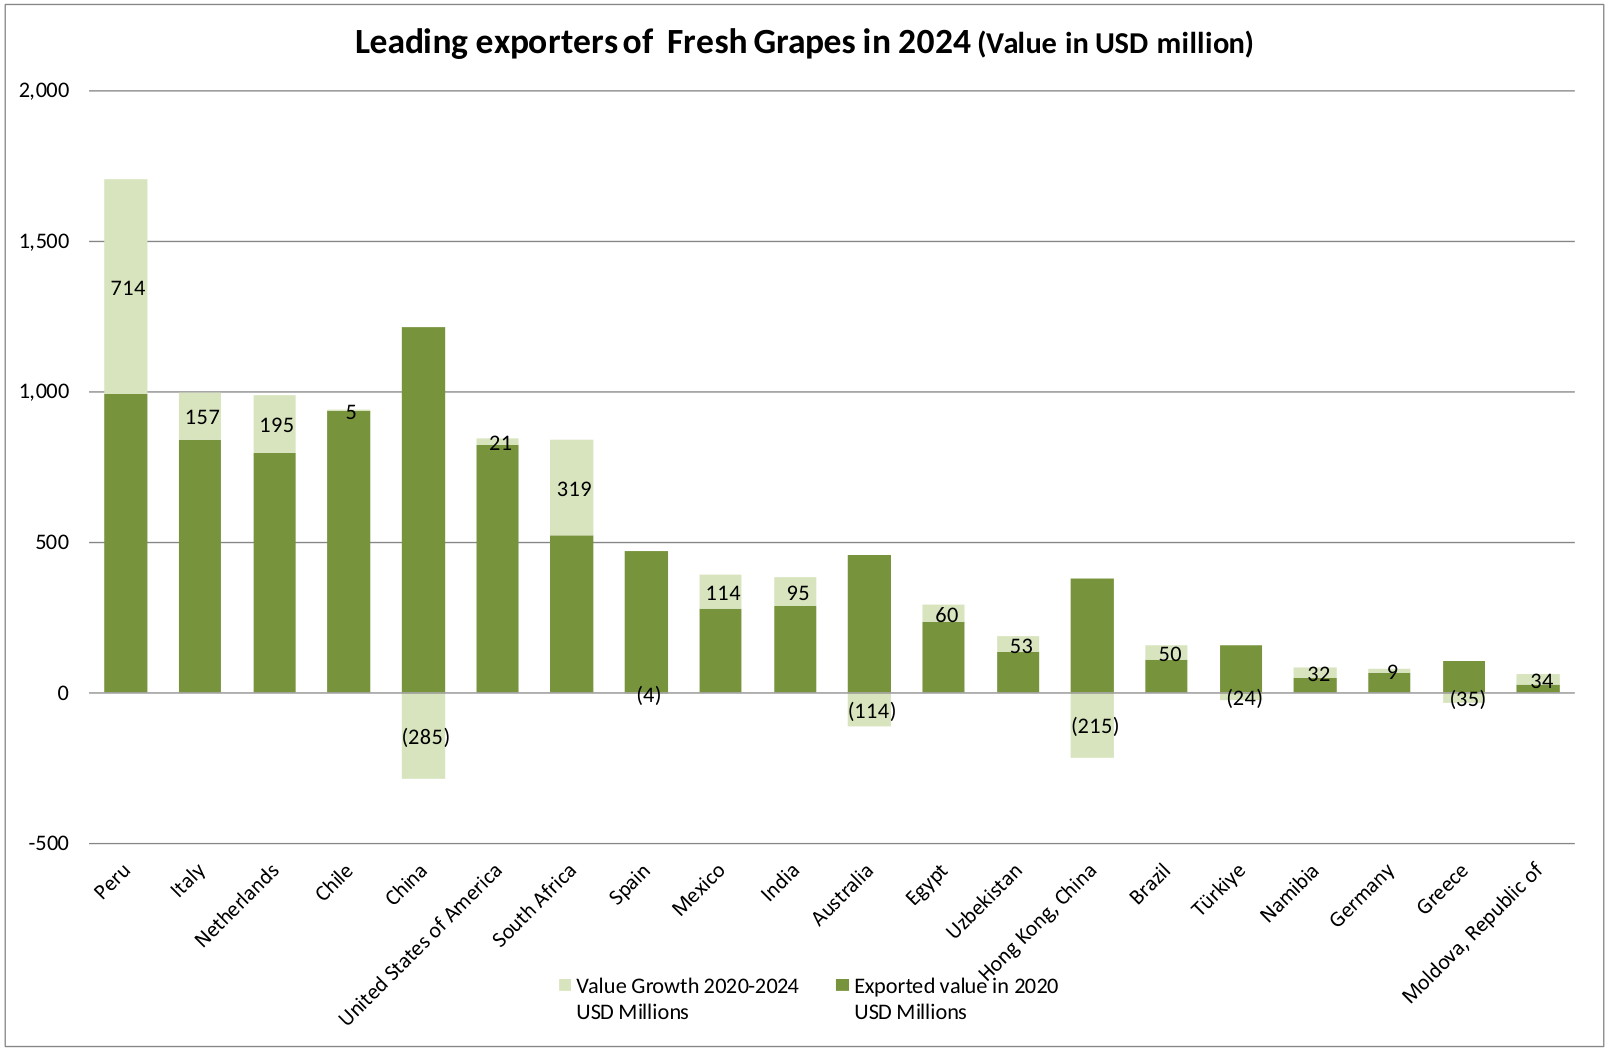
Table 1. Overview of Table Grapes harvest windows in the world’s leading production countries
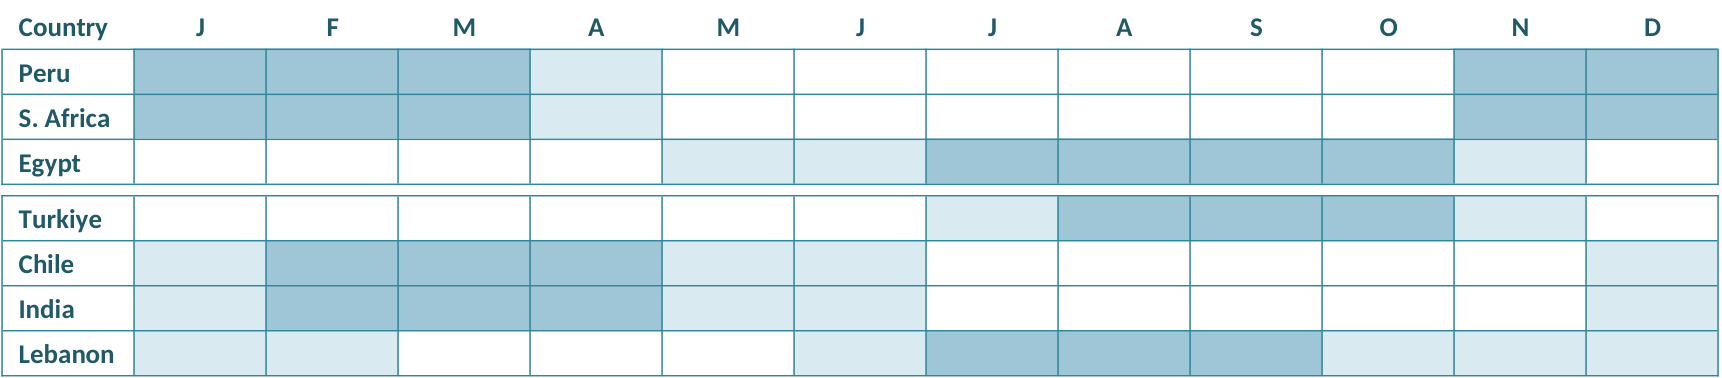
Table 2. List of supplying markets for a product imported by the most potential European markets in 2024
What are the trends in the 20 largest importing countries?
Europe remains particularly relevant for Lebanese exporters. In 2024, the main European importers included Germany, the United Kingdom, the Netherlands, France, Poland and Spain. This means that Europe continues to offer strong market potential, but not all markets are moving in the same direction. Some importers have shown good growth in recent years, such as Spain, France and Germany, while others, such as the Netherlands, have recorded a decline in import value over 2020–2024. For Lebanese exporters, this means that market selection matters: some destinations are expanding, while others remain important mainly because of their trading role.
In Asia, import demand is also significant, especially in Indonesia, China, Thailand, the Philippines and Viet Nam. Several of these markets recorded solid import growth between 2020 and 2024, showing that demand is not limited to Europe and North America. For Lebanese exporters, these markets may represent longer-term diversification opportunities, although they are generally more distant and may involve more complex market access conditions.
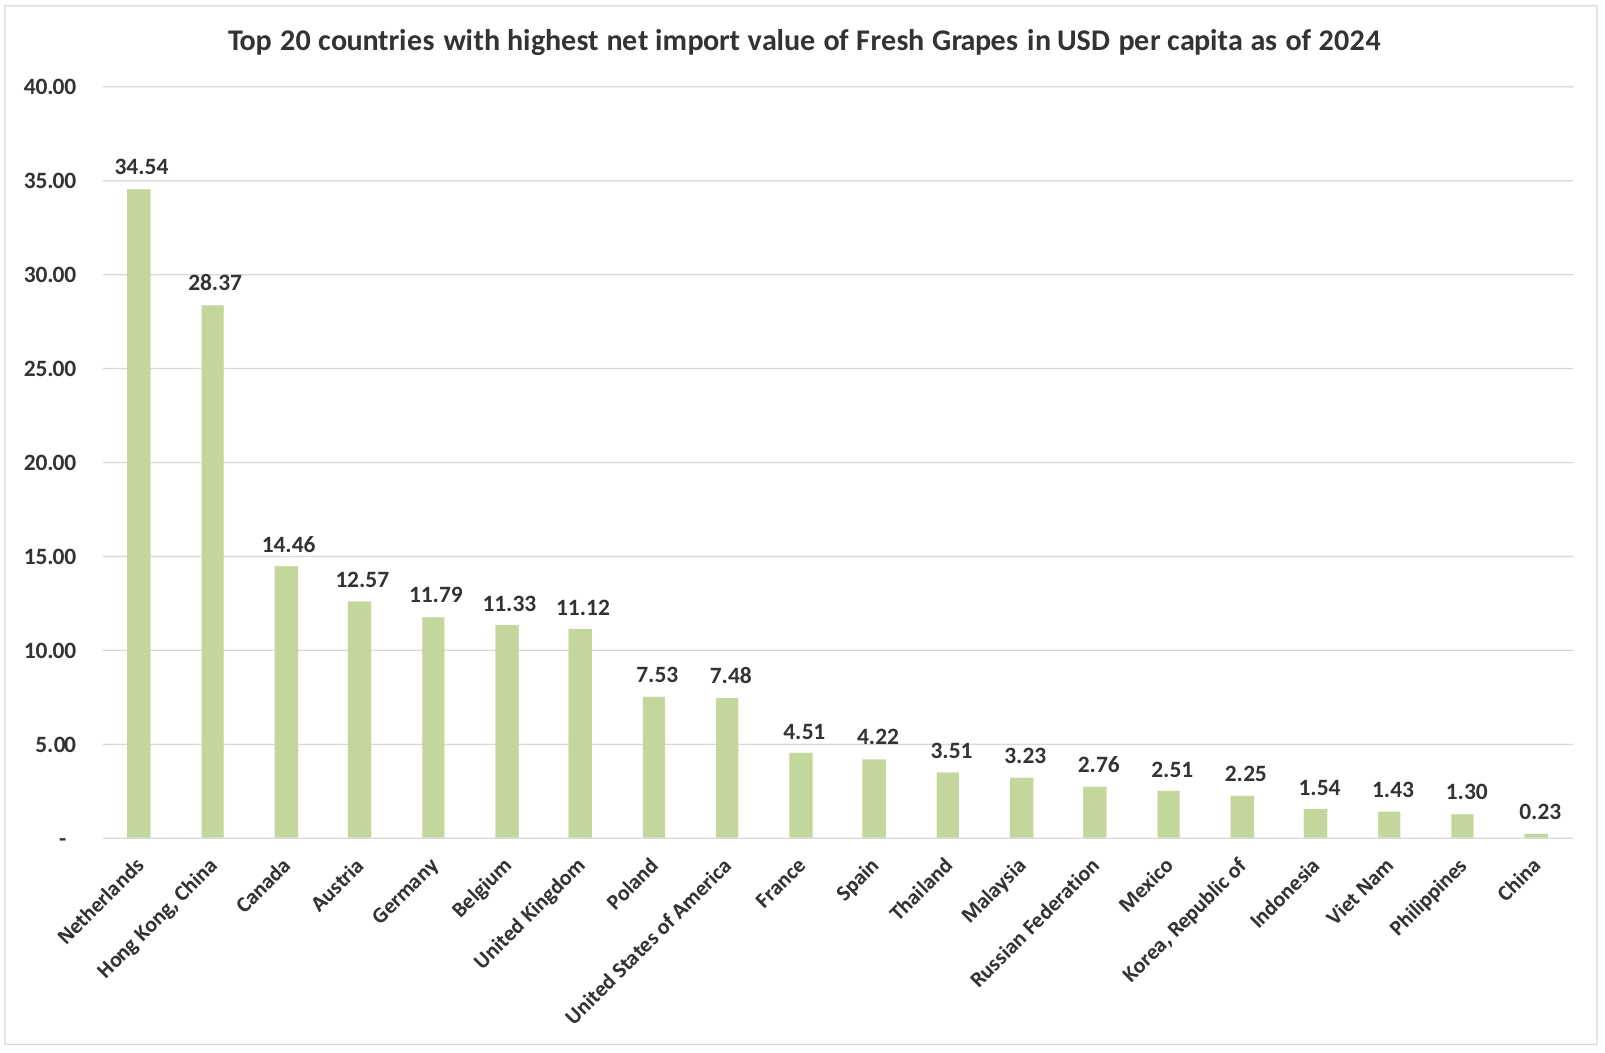
Interestingly, the per capita import statistics of 2024 (as shown in Fig. 4); show that the Netherlands, China and Canada topped in Table Grapes consumption. It also shows that there is still a huge potential for growth in countries with lower per capita like Austria, Germany, Belgium and UK.
Figure 3. Leading importers for Table Grapes in 2024 - Source: ITC Trade map
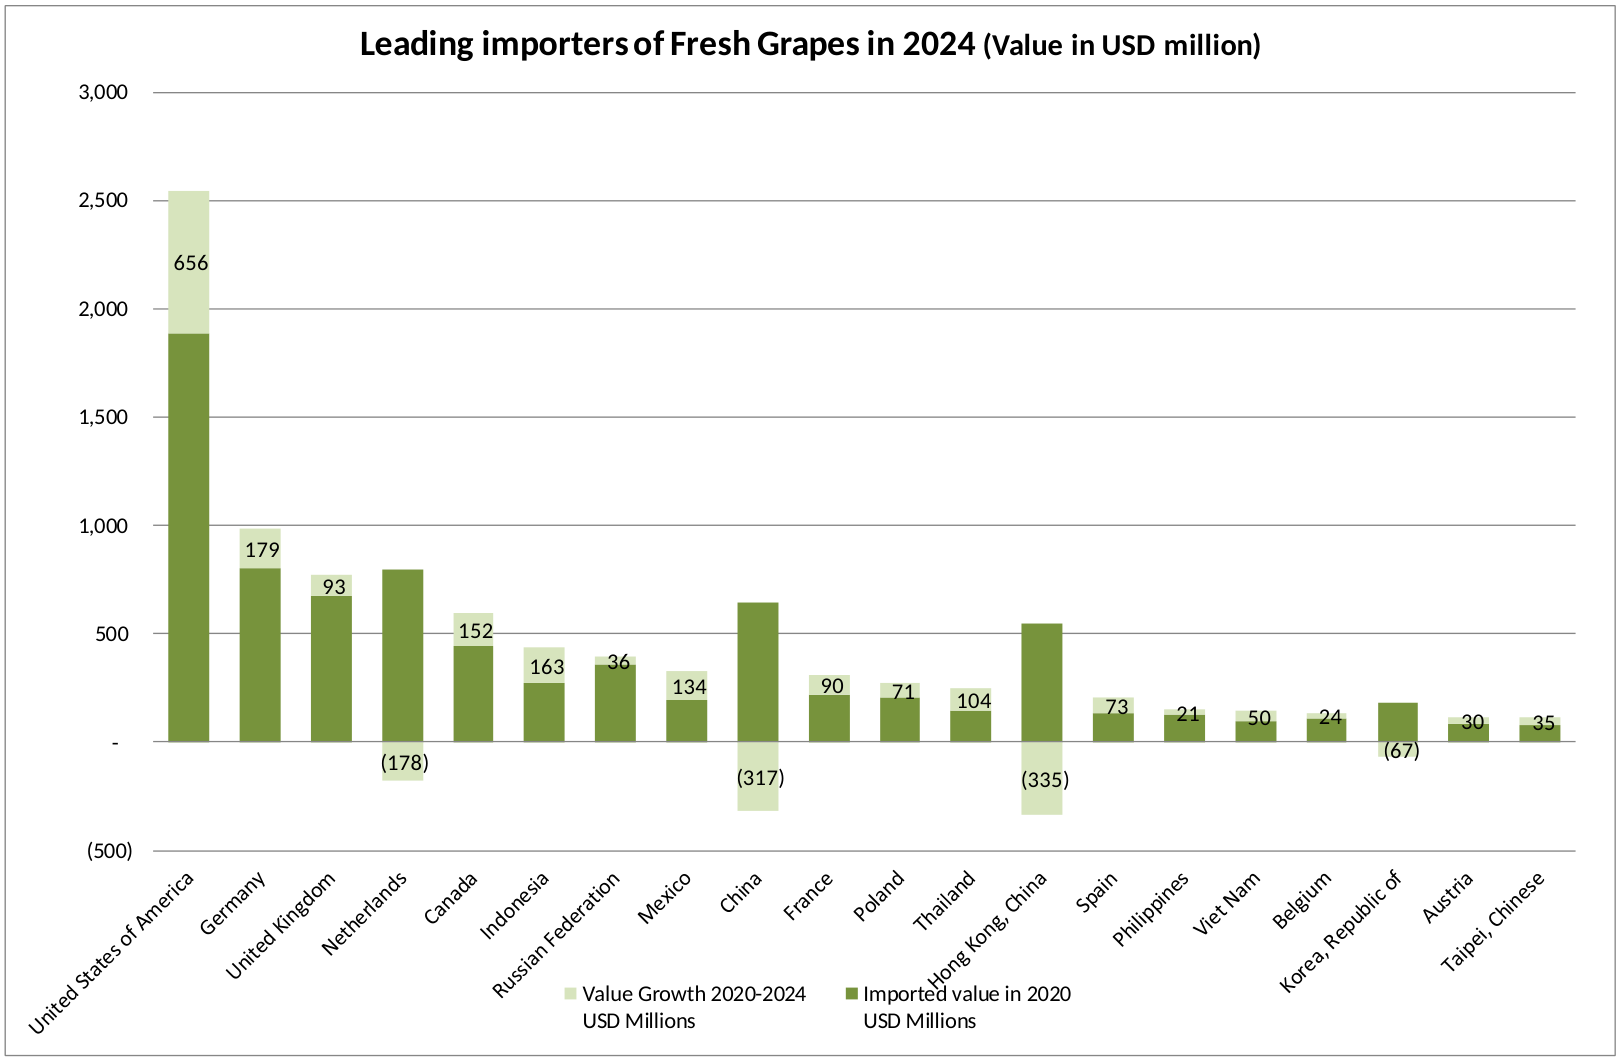
Figure 4. Top 20 countries with highest net import value of Table Grapes in USD per capita in 2024 - Source: ITC Trade map
What are the trends in trade in the Middle Eastern Market?
That said, recent trends show a mixed picture. Between 2020 and 2024, imports grew moderately in several GCC markets, including the UAE, Qatar, Bahrain, Oman and Kuwait. However, between 2023 and 2024, imports fell in Saudi Arabia, the UAE and Qatar, while growth remained modest in Oman and Kuwait. For Lebanese exporters, this means that GCC markets are still important, but they cannot be treated as guaranteed growth markets. They require closer market monitoring and stronger positioning.
A simple takeaway for Lebanese exporters is this: large markets such as the United States and Europe show where global demand is concentrated, while the GCC remains a natural nearby market for Lebanon. The best opportunities are likely to come from combining a strong presence in traditional regional markets with selective expansion into larger, high-potential import markets.
Figure 5. Imports of Table Grapes in Middle East in 2024 - Source: ITC Trade map
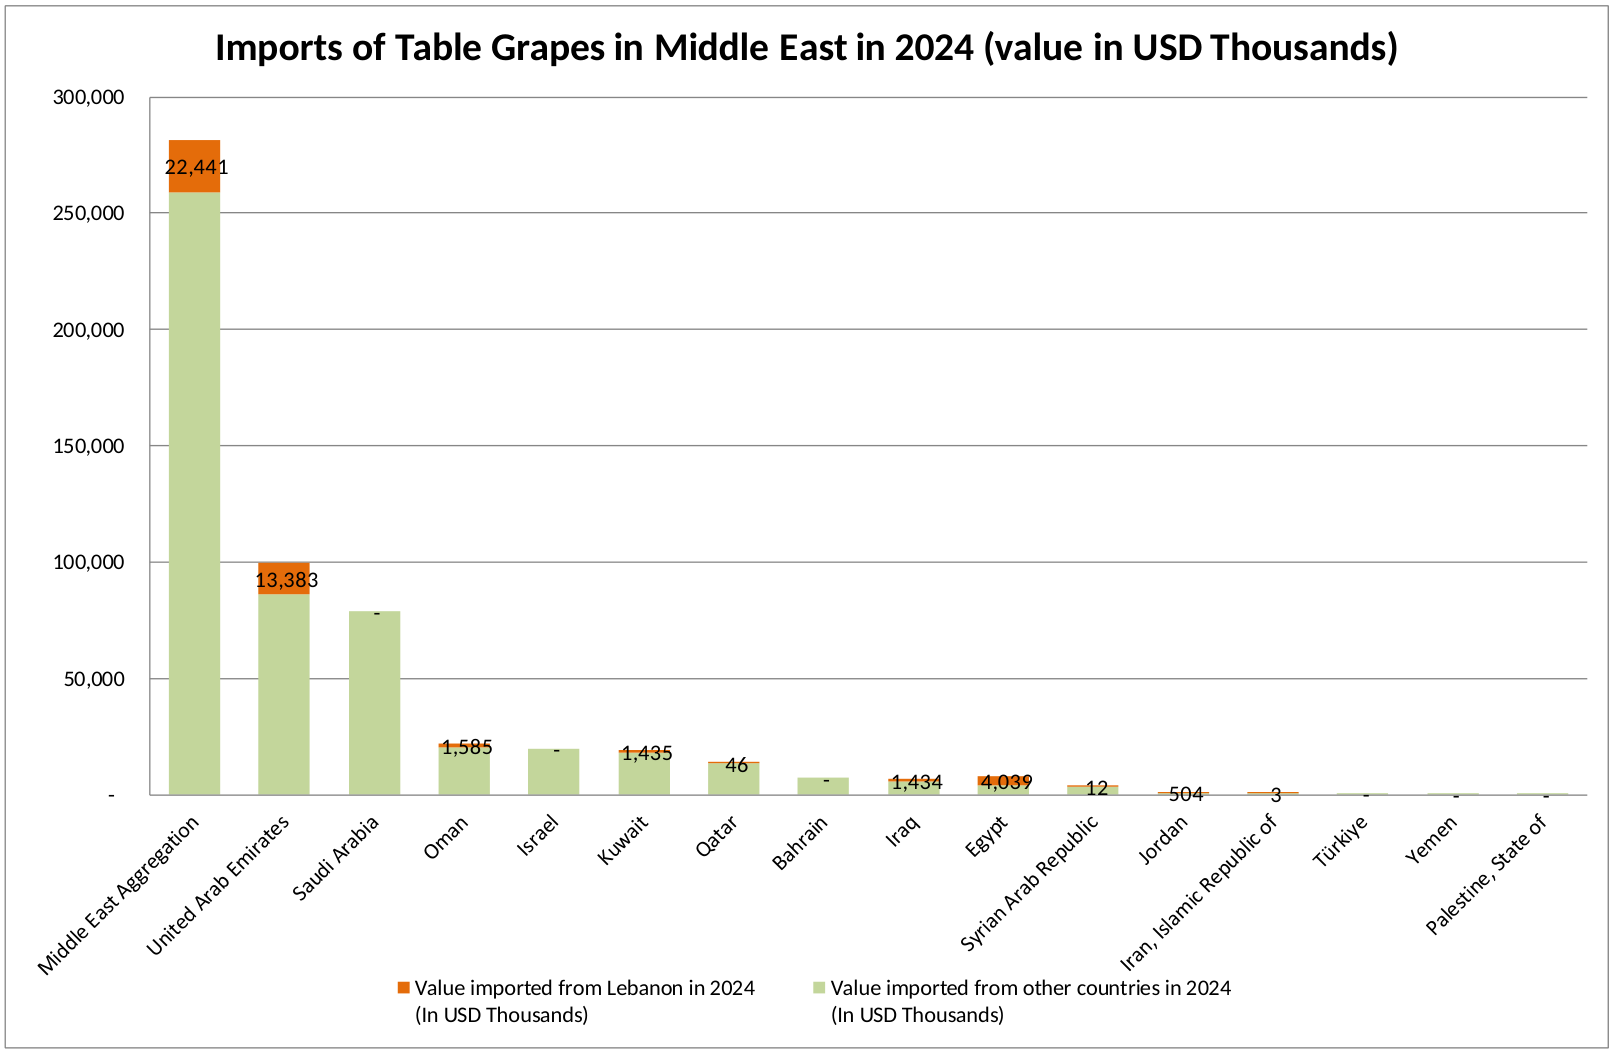
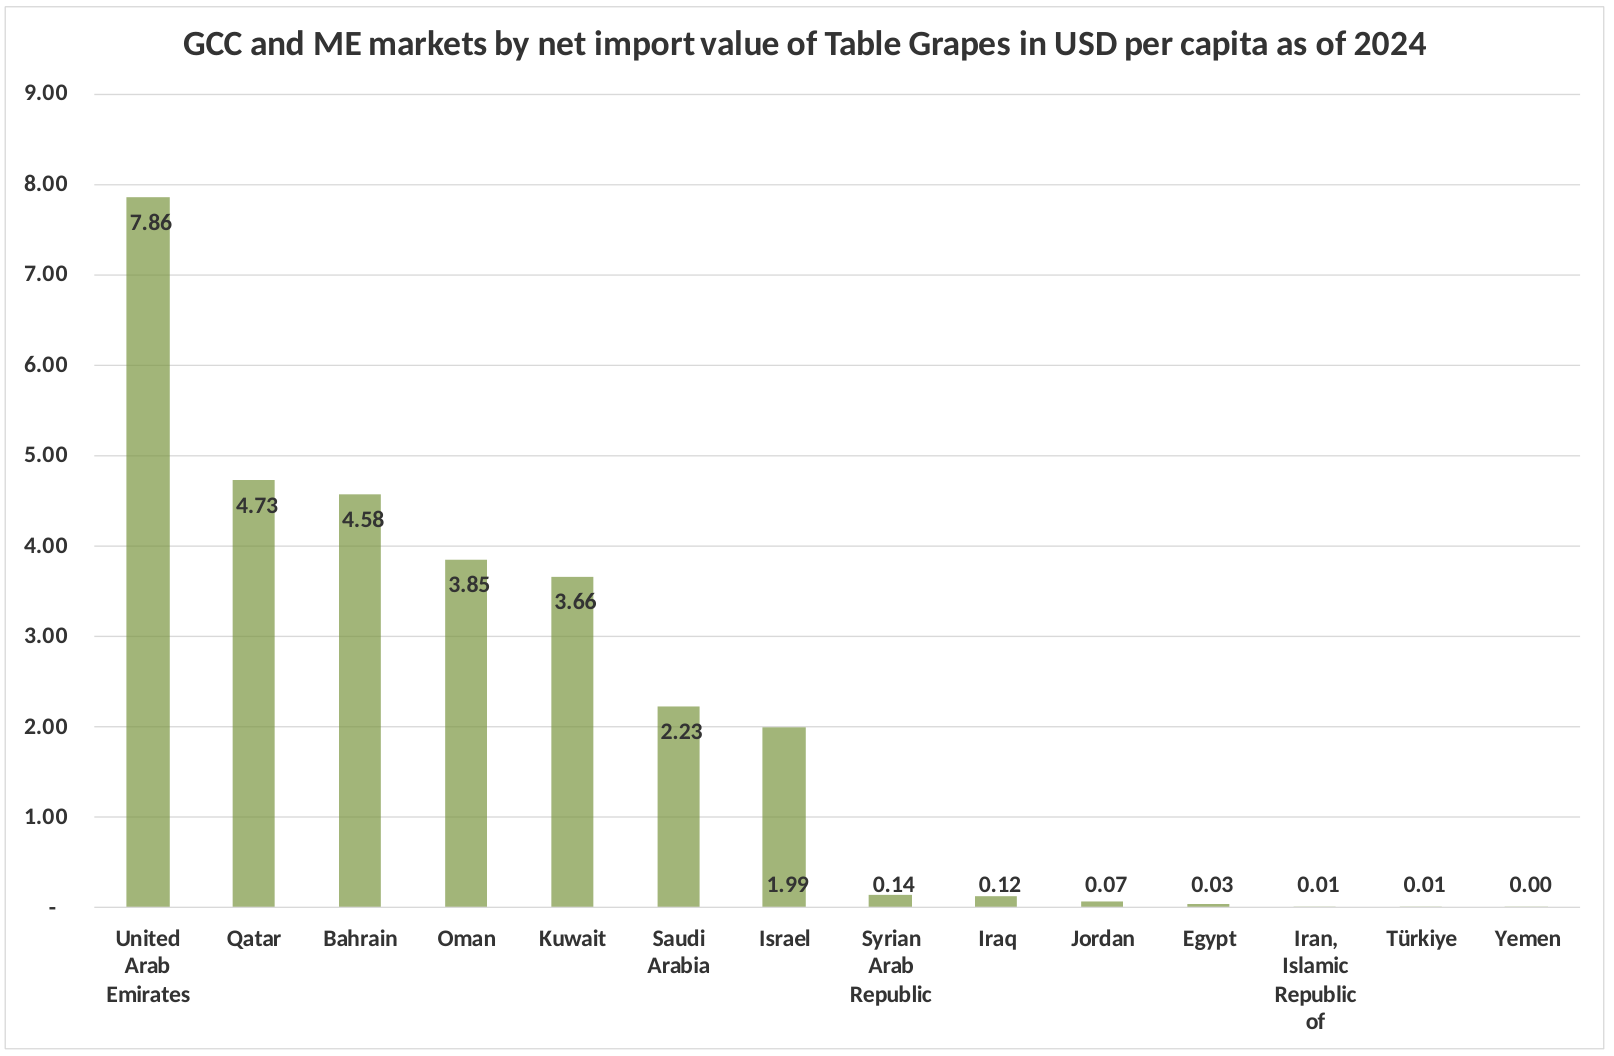
Figure 6. GCC and ME imports of Table Grapes in USD per capita as of 2024 - Source: ITC Trade map
What are interesting markets for the future?
In Europe, Germany and the United Kingdom stand out as the strongest destination markets because of their large import value, while the Netherlands is especially important as a gateway into Europe rather than only a final market. CBI also highlights these three markets as the main European opportunities for table grapes, with the Netherlands playing a major hub role and Germany and the UK offering large-volume demand.
CBI also shows why Europe remains attractive: demand is stable, imports are needed year-round, and developing-country suppliers are gaining ground. It also points out that seedless grapes, reliable supply, low pesticide residues, and more sustainable packaging matter more and more, especially in Germany and the UK.
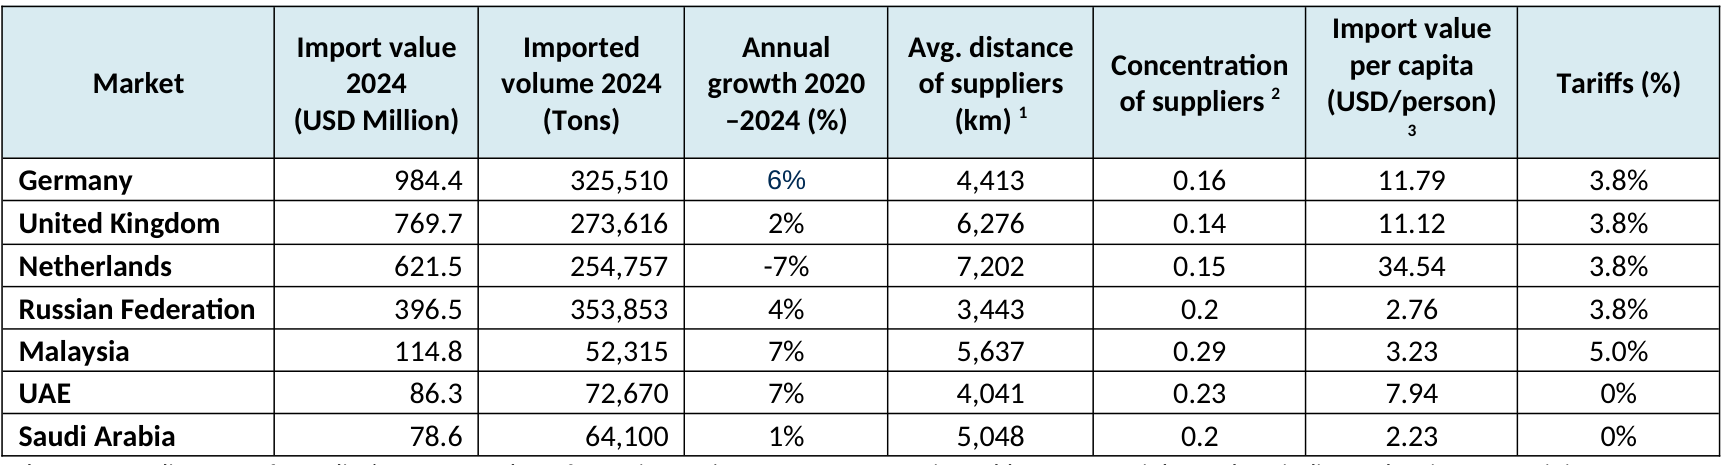
Outside Europe, the Russian Federation stands out as a large-volume market, Malaysia as a smaller but growing Asian market, and the UAE and Saudi Arabia as important nearby regional markets. Together, these seven markets offer a good mix of large consumer markets, hub markets, and regional priority markets.
Table 3 below compares these seven markets using the main factors that matter most for Lebanese exporters, including import value, imported volume, growth, supplier distance, supplier concentration, and import value per capita.
The average distance of supplier’s measures how far an importing country sources its Table Grapes. Higher values indicate that imports originate from more distant countries, while lower values suggest that imports are sourced mainly from neighboring countries.
2 The concentration of suppliers is an index ranging between 0 and 1. Values closer to 0 indicate a diversified supplier base, with imports sourced from multiple countries, while values closer to 1 indicate a high concentration, meaning imports are sourced from a small number of countries (typically two or three).
3 The ratio of imports of Table Grapesin USD value and the population of each country.
Table 3. Top potential markets for Lebanese Table Grapes
Markets with Highest Export Potential




Tips
- Given the fierce competition from European suppliers, good quality, adequate packaging in punnets as needed for supermarkets and compliance with various certifications, are preconditions for market entry of Lebanese grapes to the European market.
- Use Lebanon’s winter window wisely. Lebanon can supply grapes from June to February, with December offering a strong entry point into Europe, especially the Netherlands, Germany, and the UK.
- Treat the Netherlands as a gateway. Exporting to the Netherlands can help Lebanese exporters access wider European markets through its strong re-export network.
- Compete on quality, not volume. Since Lebanon is smaller than major exporters, it is better to stand out through flavour, quality, timing, and niche markets.