Promising Markets For Pickles
Overview
Lebanon has been one of the main exporters of pickled products worldwide over the past two decades and among the top 20 exporters of such products for the last two years. Exports have been growing at a CAGR of 8.5% from $4,022,000 in 2001 to $18,896,000 in 2020[1]. In the coming years, promising opportunities can be found in Canada and the U.S. for Lebanese pickle producers. This document gives an overview of the pickle market, takes a closer look at Lebanon’s exports and worldwide imports, and highlights potential growth opportunities for Lebanon’s exports of pickles.
Product Definition
Pickles and pickled products consist of a variety of fruits and vegetables that have been conserved through a mixture of acidic solution, salt, and spices. There are six basic types of ingredients used in the process: the main food that will be pickled, acids or brine, colorants, flavorings, preservatives, and stabilizers which consist of the liquid in which the pickled product is sold. In addition, the pickling process is based on two main components: lactic acid fermentation and the possibility of salting the vegetables, which would result in different end products, tastes, and textures. Moreover, hygiene practices are crucial in the pickling process, as the fermentation process does not require the heating of vegetables and fruits.
The lactic acid bacteria brew sugar during the fermentation process into lactic acid, thus avoiding the formation of toxic bacteria and fungus in the pickling process. Additionally, salt is a key component in the process as it affects the level and form of fermentation, and therefore it is recommended that the bacteria grow in a low concentration of salt. In this context, 2% to 5% of salt will yield pickles with high levels of acidity, and higher levels of salt (up to 16%) will result in salt-stock pickles, in other words, pickles in high salt concentration. Sugar is among the inputs that are sometimes added to sweeten the pickles or to increase the degree of fermentation. Moreover, the temperature and the level of pH should be monitored in order to avoid the development of unwanted bacteria.
Furthermore, pickles are an essential part of the Lebanese cuisine, as well as cultural traditions and an important side-dish in restaurants as well as in every Lebanese house. They constitute a major part of the Lebanese “mouneh”, which is a bundle of traditional Lebanese food preparations that is done by villagers to preserve their own local food and crops, mainly at the beginning of the autumn season.
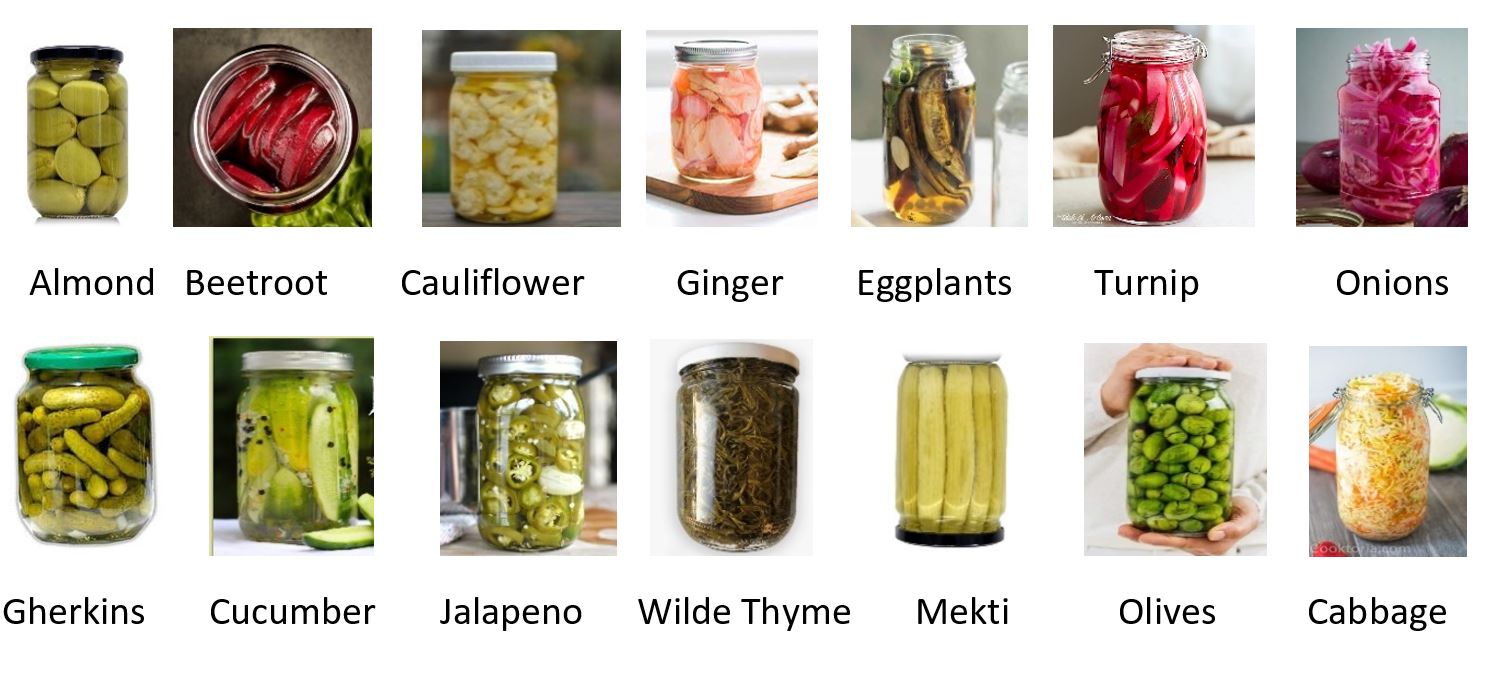
The most known types of pickles in Lebanon are Mekti, cucumber, gherkins, jalapeno, wild thyme, eggplants, beetroot, almond, turnips, onions, carrots, cauliflower, olives, mixed vegetables, among others. This report uses the combined nomenclature code 2001 ‘Vegetables, fruit, nuts, and other edible parts of plants, prepared or preserved by vinegar or acetic acid’.
The lactic acid bacteria brew sugar during the fermentation process into lactic acid, thus avoiding the formation of toxic bacteria and fungus in the pickling process. Additionally, salt is a key component in the process as it affects the level and form of fermentation, and therefore it is recommended that the bacteria grow in a low concentration of salt. In this context, 2% to 5% of salt will yield pickles with high levels of acidity, and higher levels of salt (up to 16%) will result in salt-stock pickles, in other words, pickles in high salt concentration. Sugar is among the inputs that are sometimes added to sweeten the pickles or to increase the degree of fermentation. Moreover, the temperature and the level of pH should be monitored in order to avoid the development of unwanted bacteria.
Furthermore, pickles are an essential part of the Lebanese cuisine, as well as cultural traditions and an important side-dish in restaurants as well as in every Lebanese house. They constitute a major part of the Lebanese “mouneh”, which is a bundle of traditional Lebanese food preparations that is done by villagers to preserve their own local food and crops, mainly at the beginning of the autumn season.
The most known types of pickles in Lebanon are Mekti, cucumber, gherkins, jalapeno, wild thyme, eggplants, beetroot, almond, turnips, onions, carrots, cauliflower, olives, mixed vegetables, among others. This report uses the combined nomenclature code 2001 ‘Vegetables, fruit, nuts, and other edible parts of plants, prepared or preserved by vinegar or acetic acid’.
Where Are Lebanon’s Pickles Currently Exported to?
Overall, Lebanon’s pickle production was estimated at about $34 million annually by USAID in 2016, with about 67% of the latter being exported to other countries.
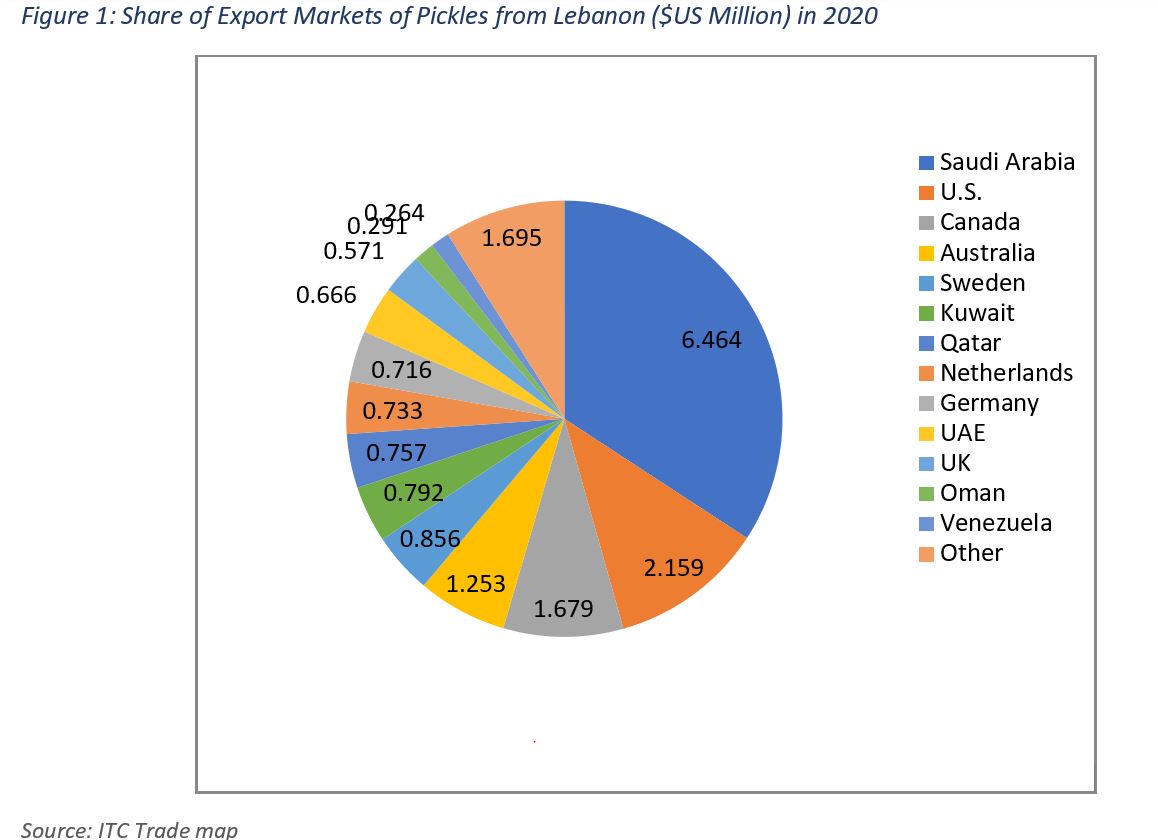
In 2020, 34.2% of Lebanon’s pickles were exported to Saudi Arabia and around 11.4% to the U.S., 8.9% to Canada, 6.6% to Australia, 4.5% to Sweden, 4.2% to Kuwait, 4% to Qatar, 3.9% to the Netherlands, 3.8% to Germany, 3.5% to the UAE, 3% to the UK, 1.5% to Oman, and 1.4% to Venezuela (Figure 1).
In 2020, 34.2% of Lebanon’s pickles were exported to Saudi Arabia and around 11.4% to the U.S., 8.9% to Canada, 6.6% to Australia, 4.5% to Sweden, 4.2% to Kuwait, 4% to Qatar, 3.9% to the Netherlands, 3.8% to Germany, 3.5% to the UAE, 3% to the UK, 1.5% to Oman, and 1.4% to Venezuela (Figure 1).
What Is Lebanon’s Position in the International Market?
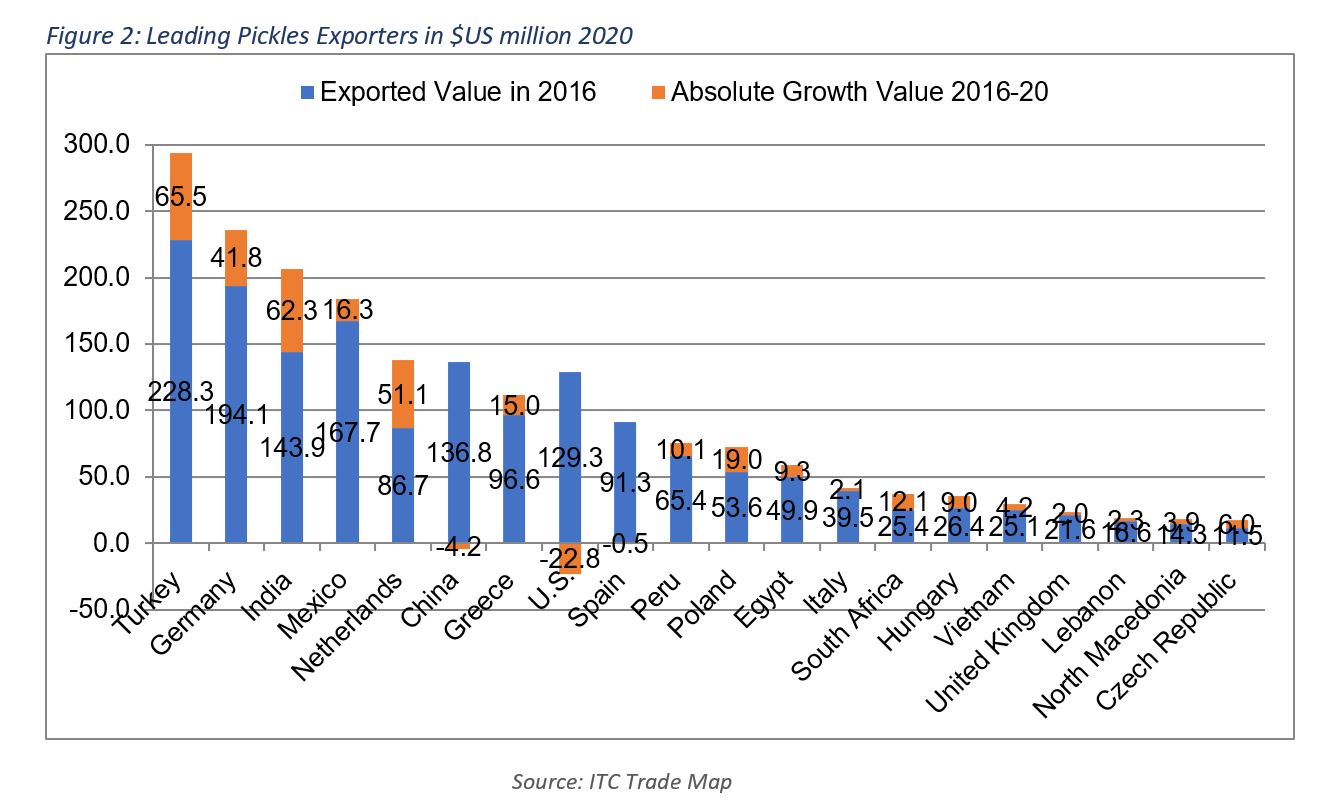
The top 20 countries in exports of pickles represent 87.3% of the total globally exported value of $2.21bn in 2020. Turkey has recently been the top exporter of pickled products worldwide, with a share of 13.3% of total exported pickles in 2020. Germany followed with 10.7%, then India with 9.3%, Mexico with 8.3%, the Netherlands with 6.2%, China with 6%, Greece with 5.1%, the U.S. with 4.8%, Spain with 4.1%, Peru with 3.4%, Poland with 3.3%, Egypt with 2.7%, Italy with 1.9%, South Africa with 1.7%, Hungary with 1.6%, Vietnam with 1.3%, the UK with 1.1%, Lebanon with 0.9%, and Macedonia and the Czech Republic with 0.8% each.
It is worth mentioning that countries of the Mediterranean Basin exported around 30% of the globally exported value in 2020.
Lebanon’s share in the value of global trade of pickled products was 0.9%. In 2020, the total value of pickled product exports from Lebanon stood at $18.9 million, a 14.6% drop compared to 2014 levels — the highest export value recorded. In the same period, the quantity of exported pickles dropped by 12.4% and leveled at 11.6 thousand tons in 2020. It is important to highlight that Lebanon ranked 18th in terms of export value and 17th in terms of export volume in 2020.
Lebanon’s share in the imports of most countries is low, which leaves room for future market share expansion. Among the countries that imported more than $0.5m of Lebanese pickles, Lebanon’s share in the countries’ imports of pickled products is relatively elevated in Saudi Arabia at 18%, in Kuwait at 10.6%, and in Qatar at 17%. Among countries that imported more than $100,000 of Lebanese pickles, the share of imports of pickles from Lebanon is relatively elevated in Oman at 9.5%, in Venezuela at 55.2%, in Cote d’Ivoire at 45.9%, and in Nigeria at 81.4%.
In terms of duties, Lebanon benefits from several trade agreements that raise the competitiveness of Lebanese pickles internationally:
- Lebanon benefits from the Greater Arab Free Trade Area (GAFTA), which allows exports from Lebanon that receive a certificate of origin to enter 17 other Arab countries, including the Gulf Cooperation Council countries.
- The EFTA-Lebanon Free Trade Agreement allows Lebanese agri-food products, including pickles, to enter the European market without paying duties, on the condition of presenting a certificate of origin.
- Lebanese pickles are also eligible for the Generalized System of Preferences (GSP) when entering the U.S.; however, the GSP is currently on hold. These free-trade agreements and reduced customs duties provide Lebanon with a competitive advantage in the main markets for Lebanese pickles. The other markets include Canada and Australia, where the customs duties on Lebanese pickled products reached 5.42% and 5%, respectively, in 2021.
What Are the Trends in Trade in the 20 Largest Importing Markets?
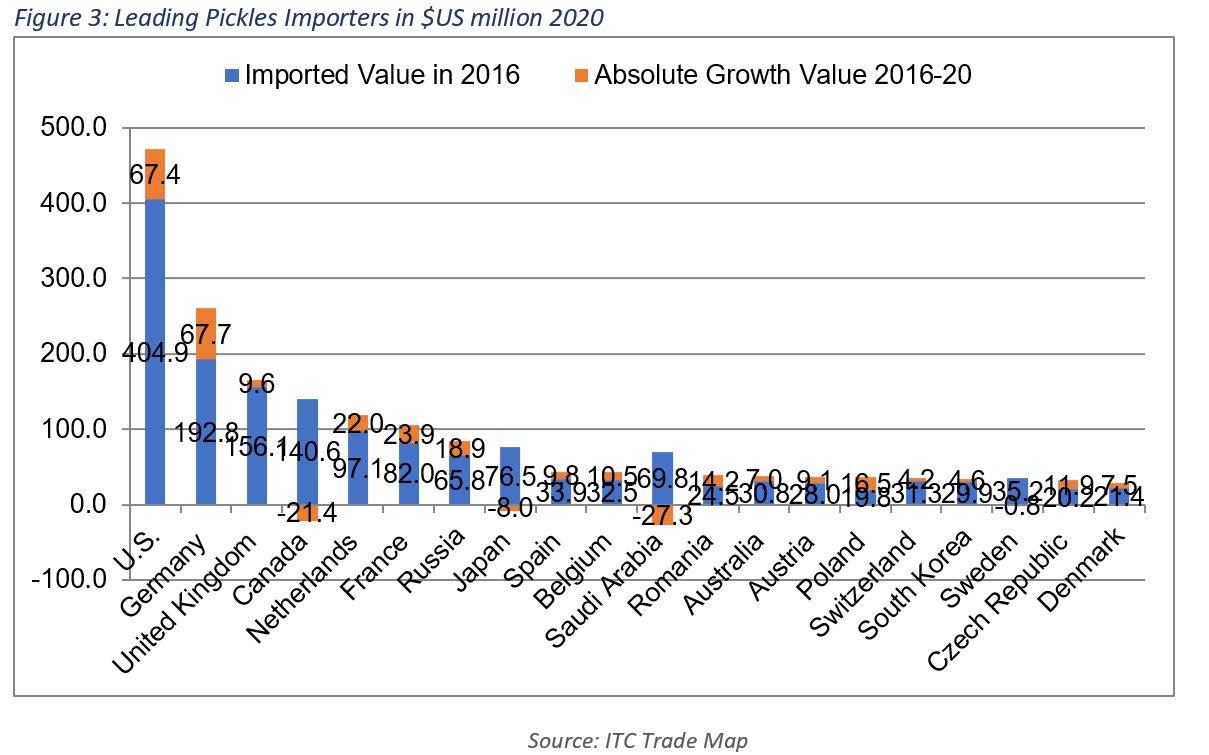
The global value of pickle imports grew significantly from $752m in 2001 to $2.3bn in 2020, increasing by a compounded annual growth rate of 6% over the covered period. More recently, they grew from $2bn in 2016 to $2.1bn in 2017, $2.25bn in 2018, and then slightly stagnated at about $2.24bn in 2019 before reaching $2.27bn in 2020. Meanwhile, based on available data, the imported quantity of imported pickles almost doubled worldwide from 829,508 tons in 2001 to 1,613,317 tons in 2018. This highlights a global increase in the price of pickles, which is likely reflecting the market dynamics of a larger demand for such products amid more interest in vegetable- and fruit-based diets and foods, as well as a healthier lifestyle.
The top 20 pickle importers constituted almost 81% of worldwide imports in 2020. For the past two decades, the U.S. remained the leading pickle importer with a 21% share of total pickle imports in 2020. The value of its imports of pickled products grew by 105.7% from 156,011 tons in 2001 to 320,865 tons in 2020. Coincidently, the average unit price of the pickles imports in the U.S. grew by 30% from $1,131.2/ton in 2001 to $1,471.8/ton in 2020.
Meanwhile, Germany retained its second place, over the same period, with a share of 11.5% in 2020. The value of such imports grew by 172% between 2001 and 2020, while the quantities imported grew by 42% over the same period to 170,668 tons in 2020. The UK has recently overtaken Canada, coming in third place since 2014. The UK and Canada’s shares of imported pickles were equivalent to 7.3% and 5.3%, respectively, in 2020. Canada outranked the Netherlands in 2010, as well as France and Russia in 2012. The increase in the value of Canada’s imports of pickles is significant at 422% from $22.8m in 2001 to $119.3m in 2020. They peaked at $150.3m in 2014, and then moved between $140m and $144m annually in the 2015-19 period, before declining by 17.3% to $119.3m in 2020. Canada’s position as a pickle importer regressed from the fifth largest importer in terms of quantity in 2018 with 98,435 tons to the sixth position in 2020 with 82,016 tons.
In the Middle East, the imported value of pickled products grew from $32m in 2001 to $109.7m in 2020; noting that they reached a peak of $162m in 2018. Saudi Arabia was the largest importer of pickles in the Middle East with a share of 38.7% of total imports in the region, followed by the UAE, Iraq, and Kuwait.
What Are Interesting Markets for the Future?
Global trade in pickled products surged significantly over the past 20 years. The rising trends of healthy lifestyles in developed markets, as well as promoting vegetable- and fruit-based diets, have pushed the consumption of pickles upwards. Additionally, food pairing and innovation, as well as the expansion in the consumption of Mediterranean food, may have had a positive impact on the demand for pickles.
As these trends remain strong, they will provide much room for growth in pickle consumption. Moreover, pickles seem like a good side dish in countries with a high level of multiculturalism, where multiple cuisines exist. These trends typically exist in Western developed countries such as Canada, the U.S., and some European countries. In addition, countries in the GCC provide a good market for Lebanese pickles due to the proximity, the Greater Arab Free Trade Area (GAFTA), and the position of these countries as net importers of pickles.
The methodology includes a calculation based on the total pickle import volume in 2020, the annual growth value, the volume of imported pickles last year from Lebanon, and the growth in the volume of imported pickles from Lebanon over the past four years, among other indicators.
As these trends remain strong, they will provide much room for growth in pickle consumption. Moreover, pickles seem like a good side dish in countries with a high level of multiculturalism, where multiple cuisines exist. These trends typically exist in Western developed countries such as Canada, the U.S., and some European countries. In addition, countries in the GCC provide a good market for Lebanese pickles due to the proximity, the Greater Arab Free Trade Area (GAFTA), and the position of these countries as net importers of pickles.
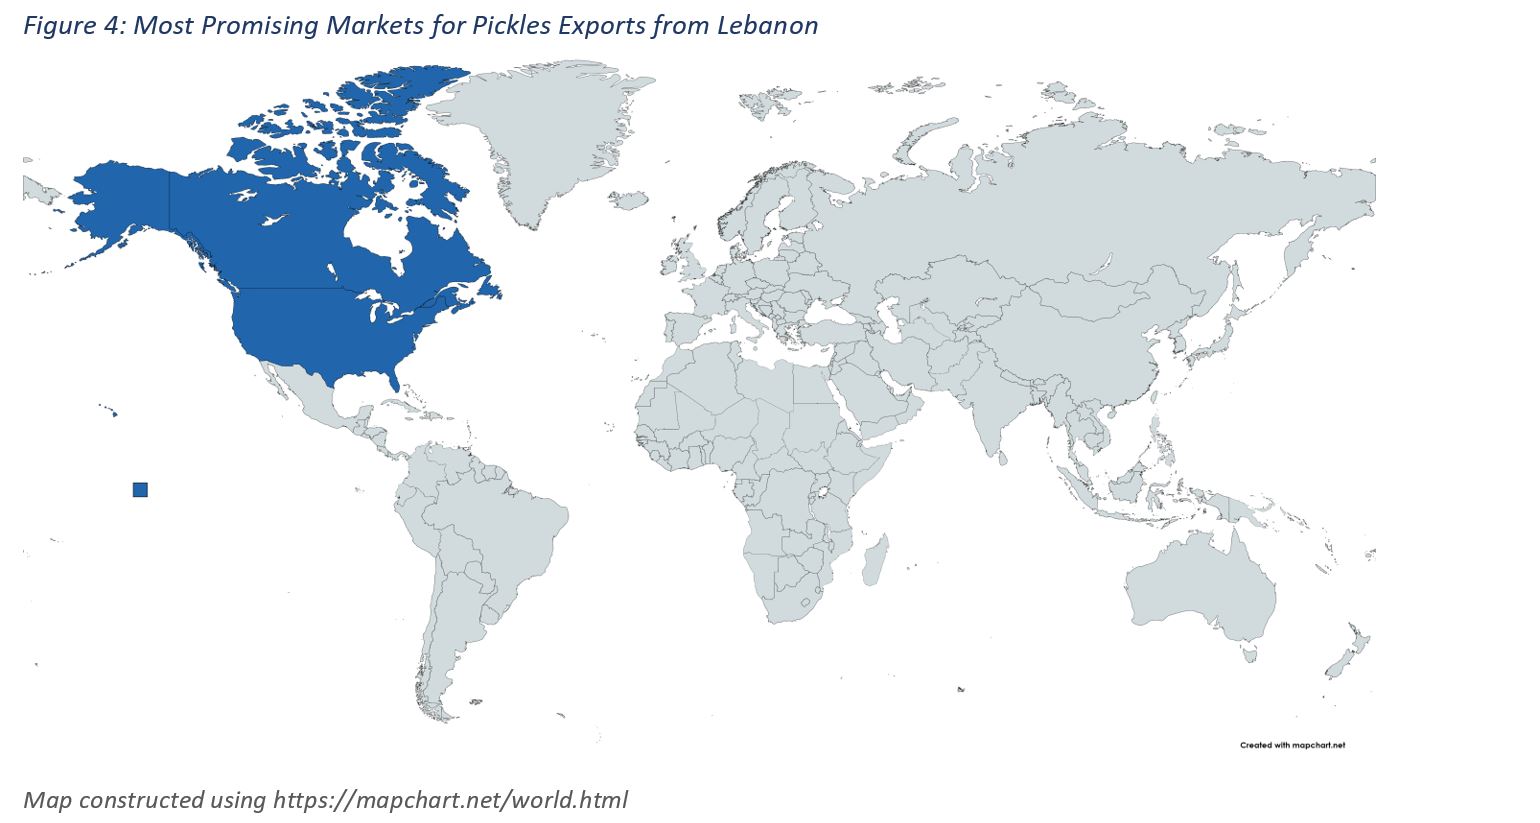
Most Promising Markets for Pickles from Lebanon
Following a model based on trade statistics and other variables, Canada and the U.S. were identified as potential markets for pickle exports from Lebanon (Figure 4). In this context, Lebanon is the 10th largest source of imports of pickles for Canada, with $1.8m in 2020, constituting 1.5% of Canada’s imports of pickles, following, the U.S., India, Greece, China, Spain, Mexico, Turkey, Poland, and Italy. Canada took about 9% of exported pickles from Lebanon. In parallel, The US is the second biggest destination for Lebanese pickle exports, accounting for 11.4% of total pickle exports after Saudi Arabia. However, according to the ITC export potential map, Lebanese companies can still tap into the American market as the unexploited export potential for pickled products is valued at USD 475K; thus, leaving room for additional trade activities.The methodology includes a calculation based on the total pickle import volume in 2020, the annual growth value, the volume of imported pickles last year from Lebanon, and the growth in the volume of imported pickles from Lebanon over the past four years, among other indicators.


Our Partners


Tips
- Focus your marketing and sales efforts on a limited range of countries, ideally in one region, after having analyzed several indicators such as the demand for the product, the imports, the outlook for coming years, and other trade-related indicators (tariffs and distance, among others).
- Assess the potential export market:
- Start with market segmentation to estimate the potential market for your products.
- Identify competitors and similar products in order to differentiate.
- Check for emerging trends on the consumers’ side as well as on the suppliers’ side.
- Check legal and quality requirements to see if your product fits, or if it is possible to do some adjustments to be able to enter the market. Make sure that you can abide by the potential quantity requirements of the potential distribution channels. Are there other barriers to entry and risks?
- Build a market entry strategy (possibly through a cost/benefit analysis)
- Choose a pricing strategy
- Establish the right position for the product
- Select the proper distribution channels
- Build your export