Promising Markets For Wine
Overview
Lebanon has ranked among the 34th and 48th of the top exporters of wine in the last two decades. Its wine exports have been growing at a CAGR of 4.84 % from $6,594,000 in 2001 to $ 16,972,000 in 2020.
In the coming years, promising opportunities can be found in Norway, Denmark, Poland, Belgium, Latvia and Romania for the Lebanese wine. This document gives an overview about the wine market, takes a closer look Lebanon’s exports and worldwide imports and highlights potential growth opportunities of Lebanon’s wine exports
Product Definition
Wines come in different varieties such as red, white, sweet, dry, still and sparkling and has different uses, as a beverage, in cooking, in religious rites, etc. Its actual alcohol content is usually less than 14.0% vol. and shall not be less than 8.5% vol. Nevertheless, taking into account climate, soil, vine variety, special qualitative factors or traditions specific to certain vineyards, the minimum total alcohol content may be reduced to 7% vol. by legislation particular to the region considered.
There are generally two categories of wines: regular (or table) wines and premium wines. Premium wine is distinct from regular wine in both quality and price. As high quality is subject to interpretation, the price point is a more suitable indicator to define whether a wine is considered a premium wine or not.
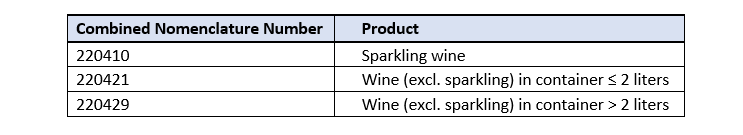
This report uses the combined nomenclature codes 220410 ‘sparkling wine of fresh grapes’ and 220421 and 220429 ‘wine of fresh grapes, including fortified wines, and grape must whose fermentation has been arrested by the addition of alcohol (excluding sparkling wine)’ in containers less than or equal to 2 liters and in containers more than 2 liters, respectively.
Where Does Lebanon’s Wine Currently Go to?
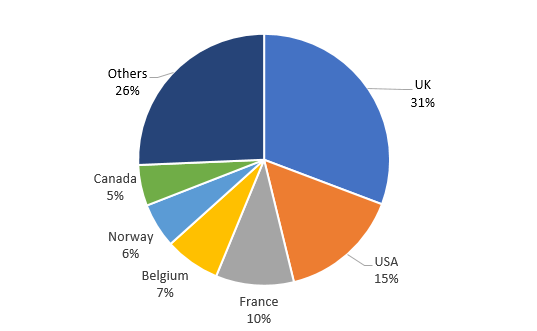
In recent years, total export volume hovered between 2 to 2.7 thousand tons per year. In 2020, Lebanon’s wine export value totaled 17 million USD equivalent to 0.05% of world wine exports. According to Lebanese customs, 0.9% of the total wine exports from Lebanon in 2020 were sparkling wine, 96.3% were non-sparkling wine in containers with capacities less than 2 liters and 2.8% were non-sparkling wine in containers with capacities greater than 2 liters. In 2020, around a third of Lebanon’s wine was exported to the United Kingdom and half to the United States, France, Belgium, Norway, Canada, Free Zones and Germany (Figure 1).
Figure 1: Share of Export Markets of Wine from Lebanon ($1000), in 2020
Lebanon’s Position in International Markets
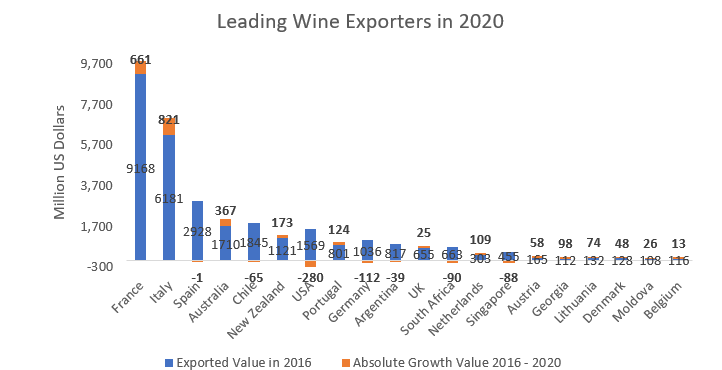
All the top producers, except China, are among the top exporters of wine. In terms of value, France has been by far the number one wine exporter of the third millennium. However, in terms of quantity, France ranked as the 3rd largest exporter. For the past few years, Italy and Spain have been exporting the largest quantities of wine. Quantity exported by the top five wine exporters dropped between 2016 and 2020, most notably in Spain. Quantities of wine exported by New Zealand, Argentina, Portugal, Moldova, Hungary, Netherlands and Austria increased over the last 5 years. Quantities of wine exported by Canada (130%), Slovakia (90%) and Georgia (86%) increased substantially in the last 5 years. For numerous countries with available data on quantity, changes in quantity and value exported varied by more than 20% implicating large variations in the unit price of exported wine.
Italy and France are two of the world’s finest wine producing countries, in terms of both quality and quantity. While Italy produces a larger quantity of wine, France is renowned for its production of premium wines; hence the greater value of exports despite the lesser quantity. Meanwhile, Spanish wine is cheaper because of the abundance of lesser-known grape varieties; additionally, Spanish wine is mostly sold in bulk to France and Italy where it is bottled, marketed and distributed.
Austrian wine exports underwent an overall increase despite the cancelation of major wine exhibitions and the closure of shops, pubs and restaurants for months. Bottled Austrian wine exports rose by 10% while bulk exports fell by 6% in 2020. Figures had also risen in 2019 hitting export records reflecting the exceptional 2018 harvest. The surge in recent years of the exports of wine from Georgia, the cradle of wine, can be attributed to the heavy investment by the wine industry and the government in raising standards and promoting products in key markets. Georgian exports to the UK underwent the most considerable increase in recent years. Meanwhile, Denmark produces very little wine and relies on imports which are partially re-exported. Similarly for Lithuania, wine production levels are low but around 70% of its imports are re-exported to Estonia, Latvia, Belarus and Russia. Growth in wine exports of both countries is mostly attributed to the growth in re-exported wine. Canada is the main producer and exporter of icewine, a type of dessert wine produced from grapes that have been frozen while still on the vine. While demand for this specialty wine increased, so did its production and exportation.
Lebanon’s share in the value of global trade of wine was 0.05%. In 2020, the total value of wine exports from Lebanon stood at $17 million, a 1.4% increase compared to 2016 levels, but a 21% drop compared to 2018 levels, the highest export value recorded. In 2020, the quantity exported increased by 0.8% compared to 2016 levels but dropped by 19% compared to 2019 levels, the highest export quantity recorded. Lebanon ranked 42nd in terms of export value and 49th in terms of export volume in 2020.
Lebanon’s share in wine imports of all countries is low (mostly less than 1%), which leaves room for future market share expansion.
In terms of duties, very few markets are a level playing field for exporters of wine, with Lebanon among the highest tariff paying countries on its wine exports to many destinations.
- Norway, Canada, the United Arab Emirates, Qatar, Bahrain, Hong Kong and Macao in China, Singapore, Cuba, Bahamas and few others do not impose any tariffs on all wine imports.
- European Union countries, the United Kingdom and Egypt faced zero tariffs when exporting wine to the EU or UK. Meanwhile, Morocco paid 0.1%, Jordan 1.9%, Palestine and Turkey 2.2%, Tunisia 3.2% and Armenia 4.8%. Lebanon and the rest of the Arab countries, Israel, Australia, USA and Argentina paid 4.9%.
- Lebanese wine exports to the United States faces 1.9% tariffs similar to Argentina, Georgia, Moldova and Brazil. Wine imports from South Africa, Canada, Israel, Australia and Mexico faced zero tariffs. The EU, UK, New Zealand, Switzerland and UK paid 2.7% taxes on their wine exports to the US.
- Imports into South American countries face high tariffs if they were exported by other countries. For instance, imports into Venezuela, Brazil and Paraguay faced 20%, 25.1% and 19.1%, respectively.
- Few countries, such as New Zealand, the US, Chile, Malaysia and China paid zero import taxes into Australia on wine products, whereas the EU paid 5% and Lebanon and most of the other countries paid 4.9%.
- South East Asian countries and African countries faced low tariffs (0.7%) on their wine imports into Switzerland. The rest paid between 16.9% and 18.7% with Lebanon on the higher end.
- Lebanon is among the countries that pay the highest tariffs on their wine exports into Japan and China.
Figure 2: Leading Wine Export
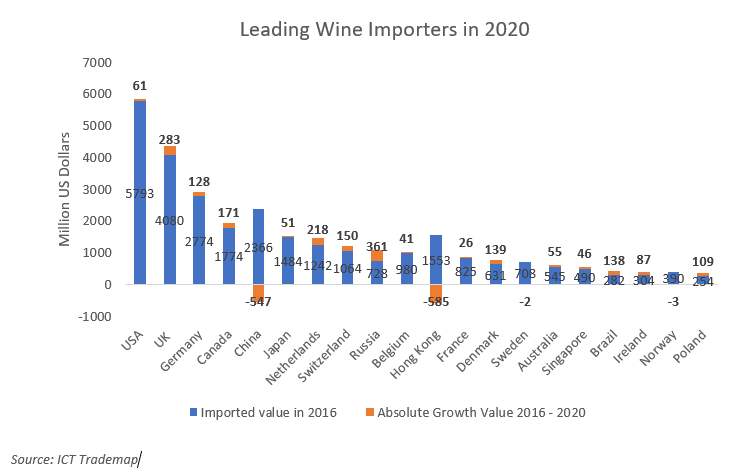
Trends in the 20 Largest Importing Markets
The top 20 wine importers accounted for 86% of worldwide imports in 2020. In 2020, the US had a 17% share of the value of total wine imports. Since 2016, the value of its wine imports increased by 1% while the quantity imported increase by 9.5%. The average unit price of US wine imports decreased by 8% from $5.2/liter in 2016 to $4.8/liter in 2020.
In 2020, the United Kingdom’s global share of imports was 13% followed by Germany’s 8.5%. Imports of both countries increased by 6.9% and 4.6% respectively from 2016 levels. While the US was the largest wine importer in terms of value, Germany was the largest wine importer in terms of volume despite the 5.6% decrease since 2016. Data of quantities imported by the UK were missing for several years but latest import statistics from 2018 show that the UK was the second largest importer in terms of volume, surpassing the US.
Between 2016 and 2020, the value of imports of China and Hong Kong decreased by 23% and 38%, respectively, while that of most of the other top 20 importers increased. In the same period, quantity imported by China, France, Japan, Germany, Switzerland and Sweden decreased by 33%, 21%, 9%, 6%, 6% and 3% respectively. The most notable increases were the 64% rise in the volume of wine imports of Brazil and the 114% rise in that of Belgium.
What Are Interesting Markets for the Future?
After being considerably affected by COVID-19, according to IWSR, the consumption of wine is expected to regain its growth momentum in the coming years.
1. Most Promising Markets for Wine from Lebanon
Following a model based on trade statistics and other variables, Norway, Denmark, Poland, Belgium, Latvia and Romania were identified as potential markets for wine exports from Lebanon (Figure 4). In 2020, 7.1% and 5.7% of Lebanon’s wine exports were imported by Belgium and Norway respectively. While shares of Denmark (0.7%), Poland (0.2%) and Romania (0.1%) were very negligible, no wine was exported to Latvia in the last decade.
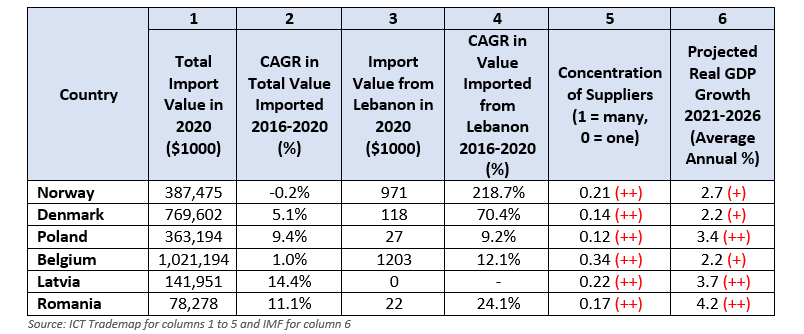
Map constructed using https://mapchart.net/world.html The methodology includes a calculation based on total wine import value in 2020 and its growth in the previous 5 years, import value of wine from Lebanon in 2020 and its growth in the previous 5 years, tariffs faced by Lebanon compared to those faced by leading competitors in the market, concentration of suppliers, and projected average growth in GDP in the period 2021-2026 (Table 1).
Figure 4: Most Promising Markets for Wine Exports from Lebanon
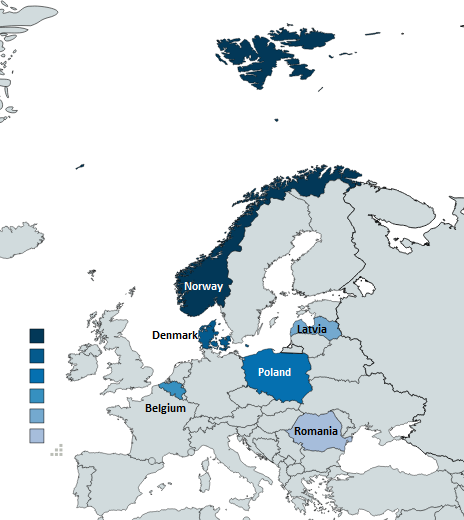
Table 1: Selection Statistics for the Top Potential Export Markets of Wine from Lebanon


Tips
- Focus your marketing and sales efforts on a limited range of countries, ideally in one region.
- Study your export market to understand its requirements and the needs of the buyers.
- Identify your competitors to potential customers in order to differentiate your product.